ISRI Monday Report
ISRIs Commodity Update | 2013-05-21 14:27:47
Commodity and equity markets lacked direction at the start of this holiday-shortened week despite the announced bailout agreement for Cyprus.
 By Paul Ploumis
For the week beginning Monday, March 25th
Commodity and equity markets lacked direction at the start of this holiday-shortened week despite the announced bailout agreement for Cyprus. In London, LME official 3-mo. copper eased to $7,640/mt ($3.465/1b.) this morning as LME copper inventories continued to build and the Euro retraced earlier gains to fall below $1.29. LME official 3-mo. asking prices were mostly softer for the other base metals as well, including aluminum ($1,932/mt = 87.6 cents/lb.), nickel ($17,010/mt = $7.72/1b.) and zinc ($1,940/mt = 88 cents/lb.). In New York, COMEX copper and gold futures dipped below $3.45/1b. and $1,605/to, respectively, although NYMEX crude oil reportedly traded as high as $95.65/bbl this morning. On Wall Street stocks opened in positive territory but quickly reversed course as the Dow Industrials were off 0.4% and the yield on 10-yr. Treasury notes dipped to 1.91% in late morning trading.
25th March, 2013 | Last | CHG % CHG | Prior Settle | Open | High | Low | ||
COMEX Copper May ($/lb.) | 3.4455 | -0.02 | -0.6% | 3.466 | 3.4655 | 3.4865 | 3.4385 | |
COMEX Gold Apr ($/to) | 1,602.0 | -4.1 | -0.3% | 1,606.1 | 1,608.8 | 1,612.8 | 1,588.4 | |
COMEX Silver May ($/to) | 28.8 | 0.1 | 0.4% | 28.7 | 28.7 | 28.9 | 28.5 | |
NYMEX Light Sweet Crude May ($/bbl) | 94.64 | 0.93 | 1.0% | 93.71 | 93.72 | 95.65 | 93.7 | |
SHFE Aluminum Jun (RMB/mt) | 14,735 | 35 | 0.2% | 14,700 | 14,750 | 14,755 | 14,720 | |
SHFE Copper Jul (RMB/mt) | 56,080 | 380 | 0.7% | 55,700 | 56,050 | 56,260 | 55,870 | |
SHFE Zinc Jun (RMB/mt) | 15,040 | 95 | 0.6% | 14,945 | 15,055 | 15,075 | 15,010 | |
No big data releases are due out in the U.S. today but later this week we'll get new figures on durable goods orders, consumer confidence, new home sales, personal income & spending and the third estimate of 4th quarter GDP. The consensus forecast is for minimal change to the GDP figure but improved personal spending and durable goods orders in Feb. Most of the major exchanges in the U.S. and Europe will be closed on Friday for the Easter holiday but we'll still have a look at the latest economic, commodity and scrap market highlights in this week's Friday Report.
Date | Time | Release | Period | Consensus | Prior |
Mar 26 | 08:30 | Durable Orders | Feb | 3.8% | -4.9% |
Mar 26 | 08:30 | Durable Goods -ex transportation | Feb | -0.2% | 2.3% |
Mar 26 | 09:00 | Case-Shiller 20-city Index | Jan | 7.5% | 6.8% |
Mar 26 | 10:00 | Consumer Confidence | Mar | 66.9 | 69.0 |
Mar 26 | 10:00 | New Home Sales | Feb | 426K | 437K |
Mar 27 | 07:00 | MBA Mortgage Index | 03/23 | NA | NA |
Mar 27 | 10:00 | Pending Home Sales | Feb | 2.0% | 4.5% |
Mar 27 | 10:30 | Crude Inventories | 03/23 | NA | -1.314M |
Mar 28 | 08:30 | Initial Claims | 03/23 | 338K | 336K |
Mar 28 | 08:30 | Continuing Claims | 03/16 | 3040K | 3053K |
Mar 28 | 08:30 | GDP-Third Estimate | Q4 | 0.3% | 0.1% |
Mar 28 | 08:30 | GDP Deflator-Third Estimate | Q4 | 0.9% | 0.9% |
Mar 28 | 09:45 | Chicago PMI | Mar | 56.5 | 56.8 |
Mar 28 | 10:30 | Natural Gas Inventories | 03/23 | NA | -62 bcf |
Mar 29 | 08:30 | Personal Income | Feb | 0.8% | -3.6% |
Mar 29 | 08:30 | Personal Spending | Feb | 0.6% | 0.2% |
Mar 29 | 08:30 | PCE Prices - Core | Feb | 0.1% | 0.1% |
Mar 29 | 09:55 | Michigan Sentiment - Final | Mar | 72.4 | 71.8 |
U.S. On-Highway Diesel Fuel Prices* (dollars per gallon) | ||||||
|
|
|
|
| Change from | |
| 03104/13 | 03/11/13 | 03/18/13 |
| week ago | year ago |
U.S. | 4.130 | 4.088 | 4.047 |
| -0.041 | -0.095 |
East Coast | 4.167 | 4.120 | 4.082 |
| -0.038 | -0.102 |
New England | 4.298 | 4.243 | 4.204 |
| -0.039 | -0.055 |
Central Atlantic | 4.235 | 4.171 | 4.140 |
| -0.031 | -0.129 |
Lower Atlantic | 4.092 | 4.058 | 4.016 |
| -0.042 | -0.090 |
Midwest | 4.085 | 4.043 | 4.015 |
| -0.028 | -0.025 |
Gulf Coast | 4.065 | 4.036 | 3.989 |
| -0.047 | -0.064 |
Rocky Mountain | 4.047 | 4.010 | 3.971 |
| -0.039 | -0.148 |
West Coast | 4.280 | 4.227 | 4.162 |
| -0.065 | -0.269 |
West Coast less California | 4.207 | 4.165 | 4.105 |
| -0.060 | -0.267 |
California | 4.341 | 4.280 | 4.212 |
| -0.068 | -0.269 |
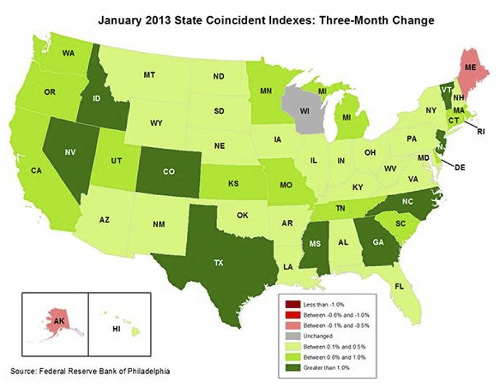
Chart of the Week: Philly Fed Indicator by State
© 2013 Institute of Scrap Recycling Industries, Inc.