 By
By 
North American Scrap Prices Weaken as Copper and Aluminum Lead Weekly Declines
Copper, aluminum, brass/bronze and stainless steel scrap benchmarks moved lower during the September 25–October 1 period, while steel, lead and zinc remained unchanged. Exchange benchmarks were also broadly weaker, with CME/COMEX copper, aluminum, lead and zinc futures all finishing below the prior week's levels.
By Carolina Curiel
Published October 2, 2026
Reporting period: September 25–October 1, 2026
Summary Points
- Copper: Broadly lower, with #3 Copper-Light Copper down 3.45% and the three major clean grades each losing $0.22/lb in the primary North American benchmark.
- Aluminum: Predominantly lower. E.C. Aluminum Wire led the decline at 4.08%, followed by Old Cast, UBC and 6063 Extrusions.
- Brass/Bronze: Modestly weaker, with Red Brass and Yellow Brass each down $0.04/lb.
- Lead and Zinc: North American scrap benchmarks held flat despite substantial weekly declines in their exchange-traded benchmarks.
- Steel: Major scrap grades were unchanged even as U.S. raw steel production rose to 1.845 million net tons and mill utilization reached 80.5%.
- Stainless Steel: 304 SS Solid declined 1.45% week over week.
MONTREAL (Scrap Monster): North American scrap metal markets entered October with a clear divide between weaker non-ferrous pricing and a comparatively stable ferrous market.
Based on the Scrap Monster Price Index, copper and aluminum recorded the most notable weekly declines, brass/bronze and stainless steel also moved lower, while lead, zinc and the major steel scrap benchmarks finished the reporting period unchanged.
The exchange picture was similarly soft across base metals. Copper, aluminum, lead and zinc futures all declined over the week, although those moves did not pass through evenly into physical scrap benchmarks.
Weekly Benchmark Dashboard
| Metal | North American Scrap | CME / COMEX Benchmark | LME Benchmark |
|---|---|---|---|
| Copper | ↓ Lower | COMEX Copper: $6.5828/lb, ↓3.05% | 3-month Copper: $14,243.50/MT |
| Aluminum | ↓ Lower | CME/COMEX Aluminum: $3,120.15/MT, ↓4.17% | 3-month Aluminum: $3,123.00/MT |
| Brass/Bronze | ↓ Slightly lower | — | — |
| Lead | → Flat | CME Group Lead: $1,863.58/MT, ↓3.96% | 3-month Lead: $1,857.00/MT |
| Zinc | → Flat | COMEX Zinc: $3,726.73/MT, ↓6.29% | 3-month Zinc: $3,724.00/MT |
| Steel | → Flat | AISI output: 1.845M NT; utilization 80.5% | Turkey Scrap $397.50; Turkey Rebar $610.00; India Scrap $403.70 |
| Stainless Steel | ↓ Lower | — | — |
SCRAPMONSTER EDGE
The most important divergence this week was between exchange markets and some physical scrap categories. CME/COMEX lead and zinc benchmarks fell 3.96% and 6.29%, respectively, yet North American lead and zinc scrap benchmarks did not move. Copper and aluminum showed much more direct alignment with the futures market, while steel remained flat even as U.S. mill activity strengthened.
NON-FERROUS SCRAP
Market Drivers
- Copper supply and benchmark volatility: Mine disruptions, constrained concentrate availability and large swings in exchange copper continued to shape physical scrap valuations. Structural demand from electrification and infrastructure remains supportive longer term, but the week's weaker futures performance weighed on near-term pricing.
- U.S. copper trade flows: Trade-policy uncertainty and changing COMEX-LME spreads continue to influence where refined copper is stored and delivered. A narrower U.S. premium reduces some of the incentive to redirect international units toward U.S. warehouses.
- Aluminum scrap availability: Market participants continue to watch increasing obsolete-scrap availability alongside more cautious downstream purchasing. Softer demand expectations can reduce competition for secondary feedstock even when primary aluminum supply remains constrained.
- Primary aluminum supply and import costs: North America remains dependent on imported primary metal, leaving regional pricing sensitive to freight, trade measures and disruptions at major smelters.
- Secondary smelter and refinery demand: Purchasing by secondary smelters, refiners and foundries remains a key determinant of non-ferrous scrap spreads. Stronger operating rates can tighten feedstock competition, while cautious buying tends to pressure scrap values.
- Brass and copper-alloy pricing: Red and Yellow Brass remain closely tied to underlying copper and zinc values as well as demand from plumbing, construction and industrial manufacturing.
Market read: Non-ferrous scrap entered October with copper, aluminum and brass under pressure, but not for identical reasons or by identical magnitudes. Copper remains highly sensitive to global benchmark volatility, aluminum is confronting softer scrap fundamentals in several grades, and brass continues to follow its underlying alloy components.
Copper Scrap Prices
Exchange benchmarks
COMEX Copper Futures closed at USD 6.5828/lb on October 1, down about 21¢ or 3.05% from the prior week. The LME Copper 3-month contract closed at $14,243.50/MT.
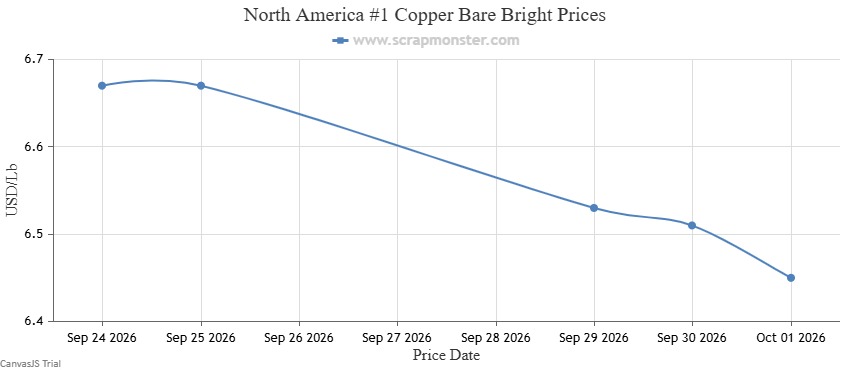
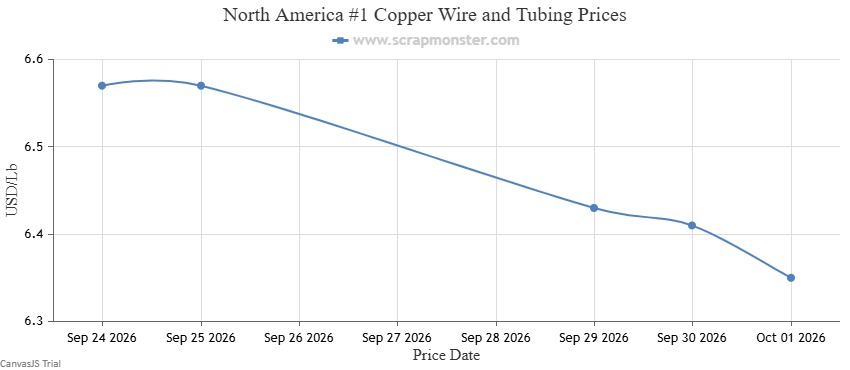
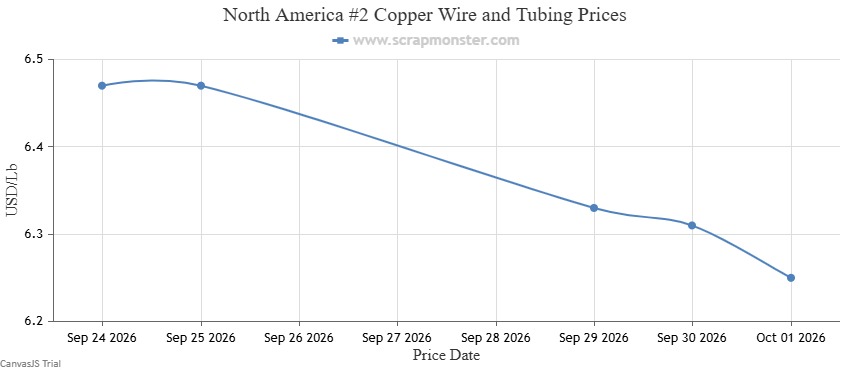
North American market: Copper scrap prices weakened broadly. #1 Copper Bare Bright fell $0.22/lb, or 3.30%. #1 Copper Wire and Tubing and #2 Copper Wire and Tubing also declined $0.22/lb, while #3 Copper-Light Copper posted the steepest percentage decline at 3.45%.
Cu/Al Radiators, Cu/Al Radiators/Fe, Cu/Al Radiator Ends, Scrap Electric Motors, Copper Transformer Scrap, Sealed Units, Xmas Lights, Alternators and Starters were unchanged.
Charts
| Category | Weekly Change | % Change |
|---|---|---|
| #1 Copper Bare Bright | -$0.22/lb | -3.30% |
| #1 Copper Wire and Tubing | -$0.22/lb | -3.35% |
| #2 Copper Wire and Tubing | -$0.22/lb | -3.40% |
Regional U.S. Comparison
| Region | Bare Bright | #1 Wire & Tubing | #2 Wire & Tubing |
|---|---|---|---|
| East Coast | -$0.22 / -3.30% | -$0.22 / -3.35% | -$0.22 / -3.40% |
| Midwest | -$0.16 / -2.43% | -$0.16 / -2.47% | -$0.16 / -2.50% |
| West Coast | -$0.22 / -3.25% | -$0.22 / -3.30% | -$0.22 / -3.35% |
International Comparison
- China: Most copper grades declined. Harness Wire 35% Recovery and Heater Cores posted the steepest percentage declines at 0.25% and 0.22%, respectively.
- India: All tracked copper categories declined. Copper Sheet Cutting recorded the largest move, down INR 10,000/MT or 1.03%.
Aluminum Scrap Prices
Exchange benchmarks
CME/COMEX Aluminum Futures closed at $3,120.15/MT on October 1, down $135.85 or 4.17% from $3,256.00 the prior week. The LME Aluminum 3-month contract closed at $3,123.00/MT.
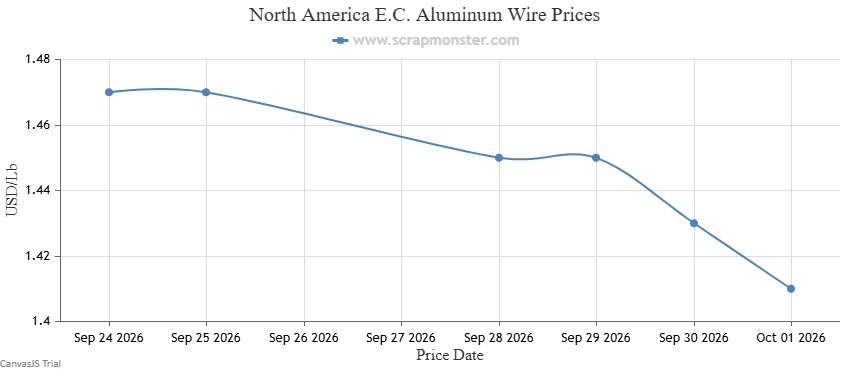
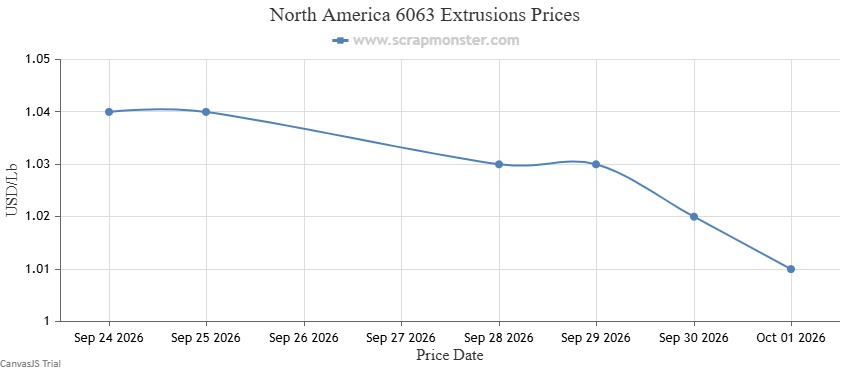
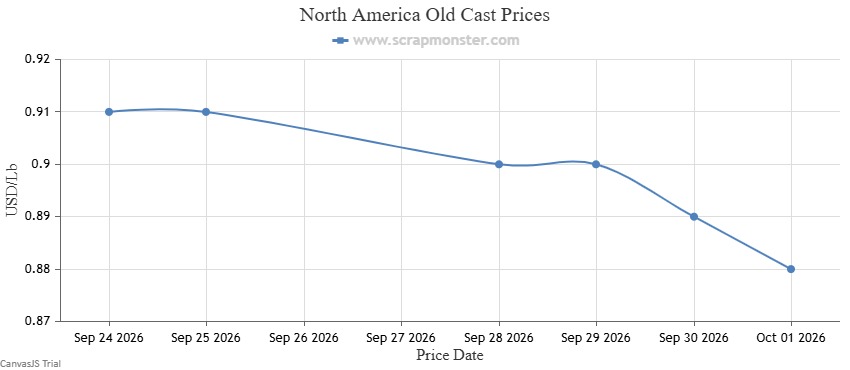
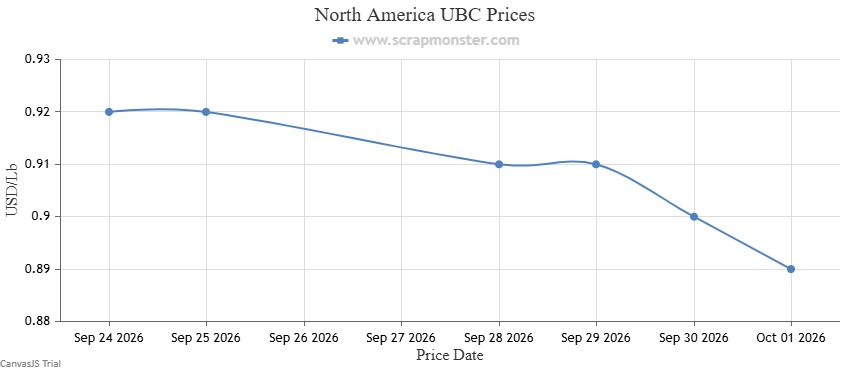
North American market: Aluminum scrap was predominantly lower. E.C. Aluminum Wire fell 4.08%, 6063 Extrusions declined 2.88%, Old Cast fell 3.30%, and UBC dropped 3.26%.
Aluminum Radiators, Aluminum Radiators/Fe, Mixed Aluminum Turnings, Al/Cu Radiators, Al/Cu Radiators/Fe, Breakage 50% Recovery and Aluminum Transformers remained unchanged.
Charts
| Category | Weekly Change | % Change |
|---|---|---|
| E.C. Aluminum Wire | -$0.06/lb | -4.08% |
| 6063 Extrusions | -$0.03/lb | -2.88% |
| Old Cast | -$0.03/lb | -3.30% |
| UBC | -$0.03/lb | -3.26% |
Regional U.S. Comparison
- East Coast: E.C. Aluminum Wire fell $0.06/lb. 6063 Extrusions, Old Cast and UBC each declined $0.03/lb.
- Midwest: E.C. Aluminum Wire fell $0.06/lb; 6063 Extrusions, Old Cast and UBC were each down $0.03/lb.
- West Coast: E.C. Aluminum Wire declined $0.06/lb; 6063 Extrusions, Old Cast and UBC each fell $0.03/lb.
International Comparison
- China: All tracked aluminum categories moved modestly lower. Old Cast and Old Sheet posted the largest moves, each down CNY 300/MT or 1.38%.
- India: All tracked aluminum scrap categories declined. Aluminum Utensil Scrap fell INR 13,000/ton, or 3.82%.
Brass/Bronze Scrap Prices
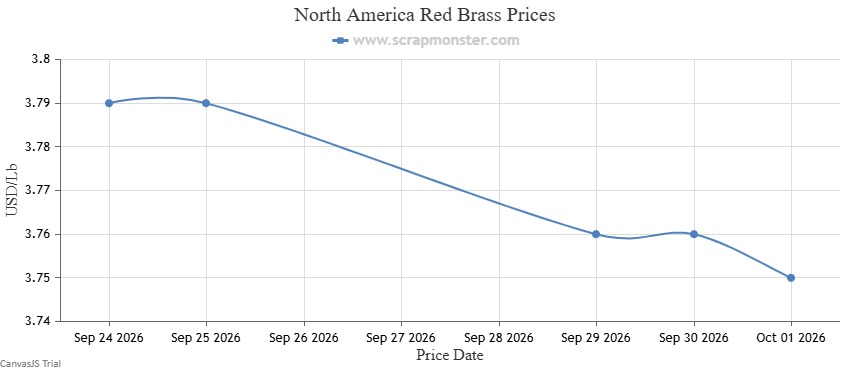
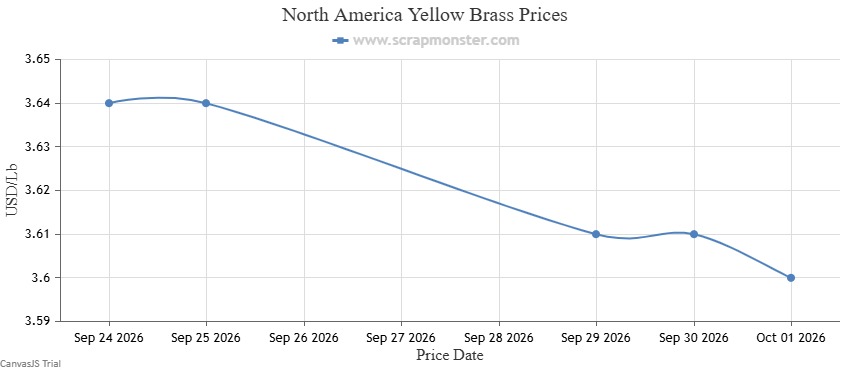
Brass and bronze prices moved modestly lower, reversing the previous week's upward move. Red Brass and Yellow Brass each declined $0.04/lb. Red Brass was down 1.06% in the primary benchmark, while Yellow Brass fell 1.10%.
Charts
| Category | Weekly Change | % Change |
|---|---|---|
| Red Brass | -$0.04/lb | -1.06% |
| Yellow Brass | -$0.04/lb | -1.10% |
Regional read: East Coast Red and Yellow Brass each fell $0.04/lb. Midwest Red and Yellow Brass also declined $0.04/lb, with Yellow Brass down 1.13%. West Coast Red Brass fell $0.04/lb, or 1.02%, while Yellow Brass also lost $0.04/lb.
International Comparison
- China: Red Brass and Yellow Brass were unchanged, while Brass Radiator Scrap declined CNY 150/MT, or 0.15%.
- India: All brass/bronze categories moved lower. Brass Cuttings posted the largest weekly decline at INR 2,000/MT, or 0.46%.
Lead Scrap Prices
Exchange benchmarks
CME Group Lead Futures closed at $1,863.58/MT, down $76.85 or 3.96% over the prior week. The LME Lead 3-month contract closed at $1,857.00/MT.
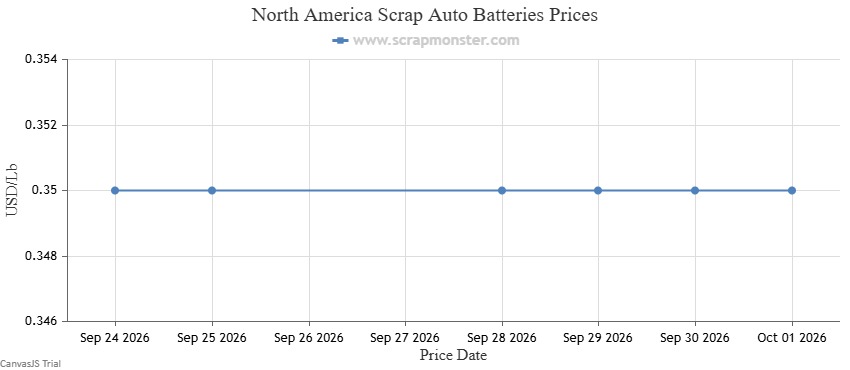
North American lead scrap remained flat. Scrap Auto Batteries showed no weekly movement across the primary North American benchmark or the East Coast, Midwest and West Coast regional readings.
Chart
| Category | Weekly Change | % Change |
|---|---|---|
| Scrap Auto Batteries | 0 | Flat |
International Comparison
- China: Auto Battery, Soft Lead and #2 Lead scrap were unchanged.
- India: Lead scrap moved lower, with Lead Ingot down INR 4,000/MT, or approximately 2.04% week over week.
Zinc Scrap Prices
Exchange benchmarks
COMEX Zinc Futures closed at $3,726.73/MT on October 1, down $250.12 or 6.29%. The LME Zinc 3-month contract closed at $3,724.00/MT.
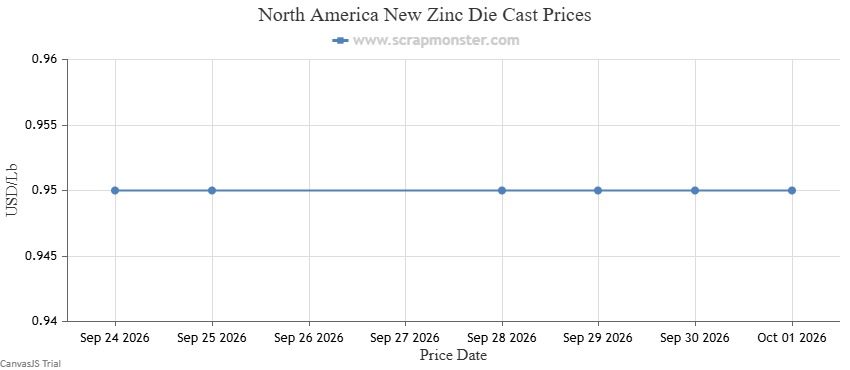
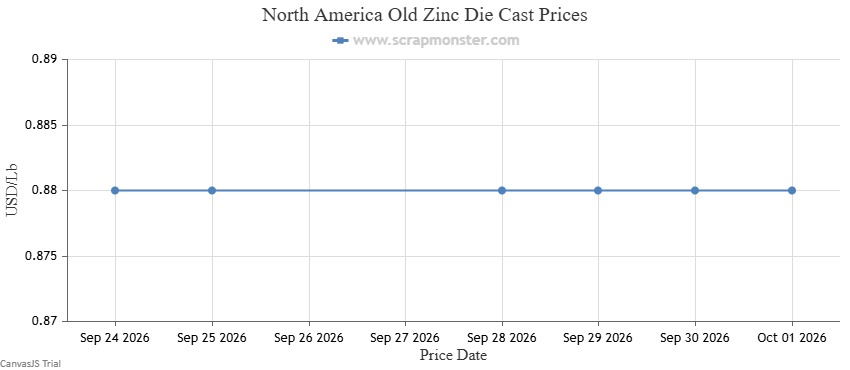
North American zinc scrap remained unchanged. Both New Zinc Die Cast and Old Zinc Die Cast held at their prior-week levels across the main benchmark and the East Coast, Midwest and West Coast regional readings.
Charts
| Category | Weekly Change | % Change |
|---|---|---|
| New Zinc Die Cast | 0 | Flat |
| Old Zinc Die Cast | 0 | Flat |
International Comparison
- China: Shred Zinc Scrap declined CNY 50/MT, or 0.27%.
- India: Tin Slab remained unchanged in the source dataset, while Zinc Slab recorded the major weekly decline.
FERROUS SCRAP
Market Drivers
- Stronger U.S. mill activity: U.S. raw steel production reached 1.845 million net tons in the week ended September 26, while capability utilization increased to 80.5%.
- Tighter inventories: Fastmarkets' October inventory indicator stood at 46.7, below the 50 level associated with average inventory conditions.
- October mill buying: Fastmarkets identified stronger demand as the principal driver entering October negotiations, while Steel Market Update also described the market as firm.
- Export competition: Improved export incentives could increase competition between domestic mills and overseas buyers for available U.S. scrap.
- Steel prices and mill margins: Firm finished-steel pricing provides mills with room to compete for metallic inputs, although scrap-price gains remain dependent on mill purchasing discipline and regional supply.
- Global excess capacity: OECD estimates global steel excess capacity at about 640 million tonnes in 2025 and projects it to reach 745 million tonnes by 2028, creating a medium-term risk for steel pricing and raw-material demand.
Market read: U.S. ferrous scrap entered October with supportive fundamentals. Mill operating rates are higher, inventories are somewhat tighter than normal and market surveys point to stronger demand. Against that, global overcapacity, imports, regional supply differences and mill-margin discipline remain important counterweights.
Steel Scrap Prices
LME Steel Benchmarks
| LME 2-Month Contract | October 1 Close |
|---|---|
| Steel Scrap CFR Turkey (Platts) | $397.50/MT |
| Steel Rebar FOB Turkey (Platts) | $610.00/MT |
| Steel Scrap CFR India (Platts) | $403.70/MT |
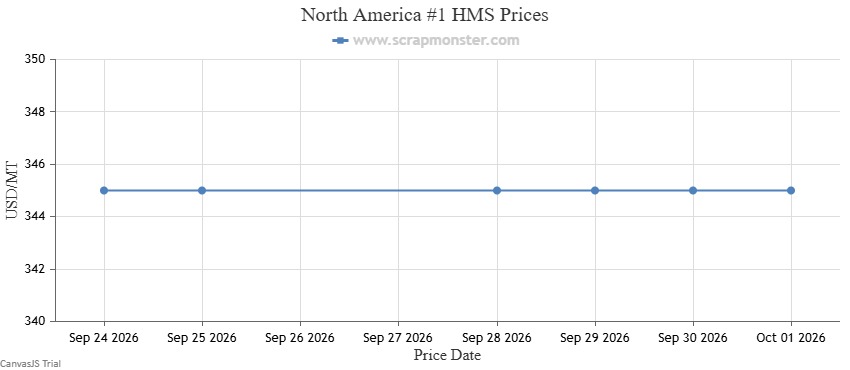
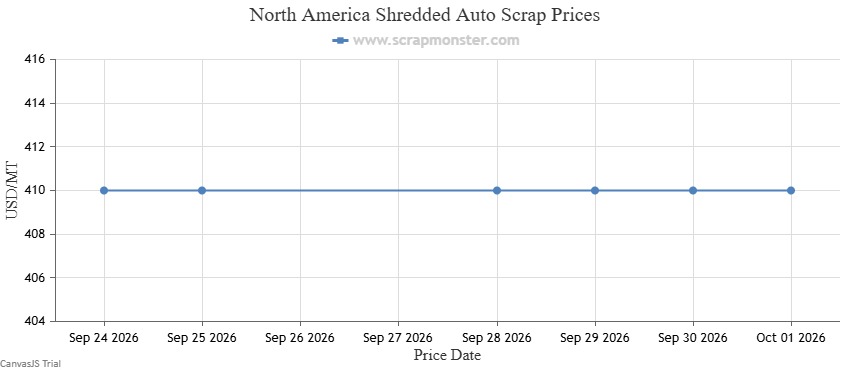
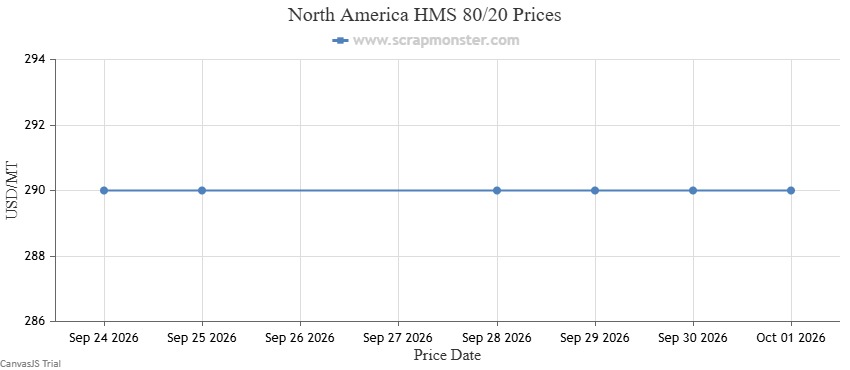
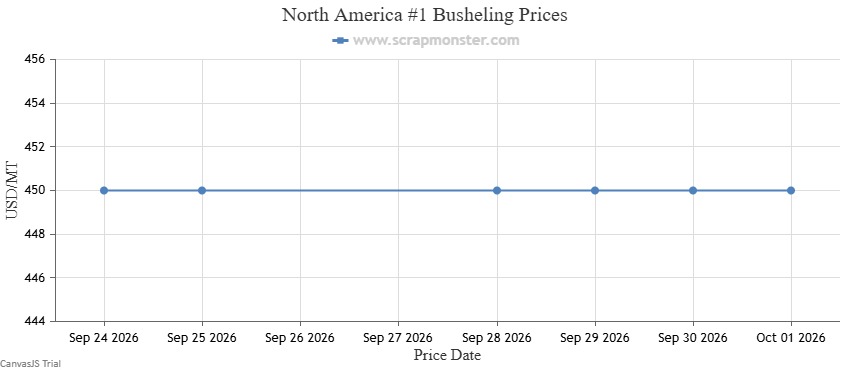
North American steel scrap prices were unchanged. #1 HMS, HMS 80/20, Shredded Auto Scrap and #1 Busheling all finished the reporting week at their previous-week benchmark levels.
U.S. Steel Production
According to the American Iron and Steel Institute, U.S. raw steel production totaled 1.845 million net tons during the week ended September 26, up 3.4% from the prior week and 3.9% year over year. Capability utilization rose to 80.5% from 77.9% one week earlier.
Regional production: Northeast 130,000 NT; Great Lakes 537,000 NT; Midwest 276,000 NT; Southern 840,000 NT; Western 62,000 NT.
Charts
| Category | Weekly Change | % Change |
|---|---|---|
| #1 HMS | 0 | Flat |
| Shredded Auto Scrap | 0 | Flat |
| HMS 80/20 | 0 | Flat |
| #1 Busheling | 0 | Flat |
Regional read: East Coast, Midwest and West Coast benchmarks for #1 HMS, Shredded Auto Scrap, HMS 80/20 and #1 Busheling all remained unchanged.
International Comparison
U.S.: Flat | China: Flat
China's #1 HMS and Cast Iron Scrap benchmarks were unchanged from the previous week.
Stainless Steel Scrap Prices
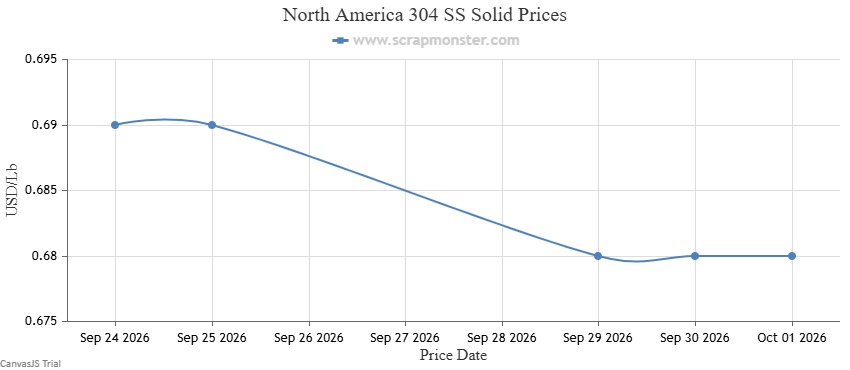
North American stainless steel scrap moved modestly lower. 304 SS Solid declined $0.01/lb, or 1.45%, during the reporting week.
Chart
| Category | Weekly Change | % Change |
|---|---|---|
| 304 SS Solid | -$0.01/lb | -1.45% |
Regional read: East Coast, Midwest and West Coast 304 SS Solid benchmarks all finished 1.45% lower; the Midwest decline equaled $0.01/lb.
International Comparison
U.S.: ↓1.45% | China: ↓0.44%
All listed Chinese stainless grades except 201 SS moved lower. The largest declines were recorded in 310 SS at 1.79% and 316 SS Solid at 1.02%.
Weekly Market Drivers
- U.S. Steel Mill Production: U.S. Raw Steel Production Rises to 1.845M Tons as Utilization Hits 80.5%
- Iowa Steel Investment: Historic $15B Iowa Steel Plant Signals Major U.S. Capacity Expansion
- Global Steel Output: Global Steel Output Falls in August Amid China Production Slump
- AISI / Overcapacity: AISI Backs New Global Framework to Curb Steel Overcapacity
- Tariffs and Quotas: Steel Forum Calls for More Tariffs, Fewer Subsidies to Fight Excess Capacity
- U.S. Imports: U.S. Steel Imports Rise to 2.35M Tons in August but Remain Lower in 2026
- South Korean Imports: U.S. Steelmakers Raise Alarm Over Surge in South Korean Steel Imports
- Green Steel: Rio Tinto, Shougang Commission 10,000-Tonne CO2 Capture Trial
Global Comparison: U.S. vs. China and India
| Metal | U.S. | China | India |
|---|---|---|---|
| Copper | ↓0.67% to ↓3.45% | ↓0.09% | ↓0.77% |
| Aluminum | ↓3.38% | ↓1.18% | ↓3.77% |
| Brass/Bronze | ↓1.08% | Flat | ↓0.42% |
| Zinc | Flat | ↓0.27% | ↓3.08% |
| Steel | Flat | Flat | — |
| Stainless Steel | ↓1.45% | ↓0.44% | — |
Expert Market View
Stephen Miller of Steel Market Update said sellers entered the October ferrous scrap market with a generally optimistic view. Buyers also acknowledged that the market was firm, although they were less certain that prices would increase. Importantly, participants were not broadly anticipating a downward cycle.
Market Outlook
October Starts With Firmer Ferrous Fundamentals
Fastmarkets' October survey points to stronger demand and somewhat tighter-than-normal inventories, while Steel Market Update's industry commentary also indicates that the market entered October on a firmer footing rather than expecting a decline.
Mill Demand Remains Supportive
Higher operating rates and purchasing requirements should continue to support ferrous scrap consumption, particularly if domestic steel production remains near current levels.
Seasonal Fourth-Quarter Factors Could Help
Normal seasonal patterns, stronger domestic demand and export activity could add support through the fourth quarter, although the degree of price response will depend on regional scrap availability and mill buying strategies.
Export Demand Is a Key Variable
Improved export economics could increase competition between domestic mills and overseas buyers. Freight rates, currency movements and international scrap benchmarks will determine how strongly that competition develops.
Global Steel Overcapacity Remains a Medium-Term Constraint
The OECD estimates global excess steelmaking capacity reached about 640 million tonnes in 2025 and could rise to 745 million tonnes by 2028. Persistent overcapacity could weigh on finished-steel margins and limit the upside for scrap if operating rates weaken.
EAF Expansion Supports Long-Term Scrap Consumption
Continued growth in electric-arc-furnace steelmaking provides a structural source of scrap demand, although the effect on pricing will depend on mill utilization, metallic mixes, DRI and pig-iron availability, and regional scrap generation.
OVERALL OUTLOOK
The near-term ferrous scrap outlook remains comparatively firm. Healthy mill utilization, stronger demand expectations and somewhat tighter inventories are supportive as October buying begins. The non-ferrous picture is less uniform, with copper and aluminum still exposed to benchmark volatility and softer physical pricing. Global steel overcapacity, mill margins, import competition and scrap collection volumes remain the principal counterweights.
Watchlist for October 5–9, 2026
| Day | U.S. / North America | Europe | Asia |
|---|---|---|---|
| Mon, Oct. 5 | S&P Global Services/Composite PMI final; ISM Services | Eurozone Composite/Services PMI final; U.K. Services/Composite PMI final | India RBI MPC meeting begins |
| Tue, Oct. 6 | U.S. Trade Balance; Canada Merchandise Trade Balance | Eurozone Retail Sales; U.K. Construction PMI | Japan Average Cash Earnings / Household Spending |
| Wed, Oct. 7 | FOMC Minutes; Consumer Credit | German industrial data | RBI rate decision; Japan Leading Indicators |
| Thu, Oct. 8 | Initial Jobless Claims; Wholesale Trade/Inventories | German trade/industrial releases | Japan Current Account and Balance of Payments |
| Fri, Oct. 9 | University of Michigan Consumer Sentiment, preliminary October reading | — | — |
Benchmark buying-price move • Exact live ScrapMonster price levels are available to Premium members. Local quotes vary by grade and location.