 By
By 
Introduction
The value of a catalytic converter lies not in its steel housing or ceramic substrate, but in the microscopic coating of precious metals that makes modern vehicle emissions control possible. Understanding what these metals are, why they're valuable, and how they influence scrap pricing is essential knowledge for anyone in the catalytic converter recycling business. This guide explains the science, economics, and market dynamics of platinum-group metals in the scrap converter market.
Whether you're processing dozens of converters weekly or managing millions in precious metals inventory, comprehending PGM fundamentals separates professional recyclers from casual sellers. The difference between selling at market peaks versus valleys can mean 30-50% variation in returns—knowledge that translates directly to profit.
The Science: Why Catalytic Converters Need Precious Metals
The Emissions Challenge
Internal combustion engines produce three primary harmful emissions that catalytic converters must eliminate:
1. Carbon Monoxide (CO)
Source: Incomplete combustion of fuel
Health impact: Poisonous gas that prevents oxygen transport in blood
Regulatory limit: Must reduce by 95%+ (EPA Tier 3 standards)
2. Nitrogen Oxides (NOx)
Source: High-temperature combustion combines nitrogen and oxygen
Environmental impact: Primary contributor to smog, acid rain, ground-level ozone
Regulatory limit: Must reduce by 90%+ (increasingly strict globally)
3. Hydrocarbons (HC)
Source: Unburned fuel exiting combustion chamber
Environmental impact: Creates ground-level ozone, photochemical smog
Regulatory limit: Must reduce by 93%+ combined with NOx
Since the 1975 Clean Air Act in the United States, vehicles have been required to reduce these emissions by over 90%. Catalytic converters accomplish this through chemical catalysis—speeding up chemical reactions without being consumed in the process. This seemingly simple requirement has profound implications for precious metals demand.
Why Precious Metals?
Only certain metals can withstand the extreme conditions inside a catalytic converter while effectively catalyzing emission-reducing reactions. The requirements are extraordinary:
- Temperature resistance: Exhaust gases regularly reach 400-800°C (750-1,470°F), with peaks exceeding 1,000°C
- Chemical stability: Must not degrade or react with exhaust components (sulfur, phosphorus, zinc, calcium)
- Catalytic efficiency: Must accelerate oxidation and reduction reactions rapidly at molecular level
- Durability: Must remain effective for 100,000-150,000+ miles of operation (10-15 years)
- Poison resistance: Must tolerate contaminants from fuel, oil, and combustion
Only platinum-group metals (PGMs)—specifically platinum, palladium, and rhodium—meet all these requirements simultaneously, making them irreplaceable in current catalytic converter technology. Research into non-PGM catalysts has continued for 50+ years, but no viable alternative has emerged for high-temperature automotive applications.
The Three Precious Metals: Roles & Properties
Rhodium (Rh) - The Valuable Reducer
Primary Function:
- Reduces nitrogen oxides (NOx) to nitrogen (N₂) and oxygen (O₂)
- Only PGM effective at NOx reduction under oxidizing conditions
- Critical for three-way catalysts in gasoline engines (hence "three-way": CO, HC, NOx)
- Cannot be substituted by other metals—no alternative exists
- Essential for meeting stringent NOx regulations (Euro 6, EPA Tier 3)
Physical Properties:
- Atomic number: 45 (rare element)
- Melting point: 1,964°C (3,567°F) - highest of all PGMs
- Density: 12.41 g/cm³
- Appearance: Silvery-white, highly reflective, mirror-like finish
- Rarity: Rarest and least mined of the platinum-group metals
- Hardness: Hardest of the PGMs, extremely durable
Typical Loading in Converters:
- Gasoline vehicles: 1-2 grams per converter (10-15% of total PGM, but 30-50% of value)
- Diesel vehicles: Near zero (NOx reduction handled by SCR/urea systems instead)
- Luxury/performance vehicles: 2-3 grams (stricter emissions, better performance)
- Hybrid vehicles: 0.5-1.5 grams (efficient operation requires less)
- California CARB converters: 20-30% more rhodium than federal equivalents
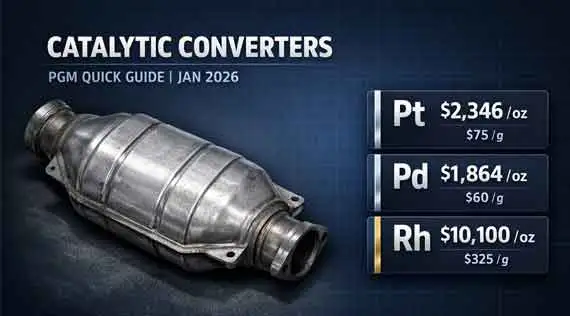
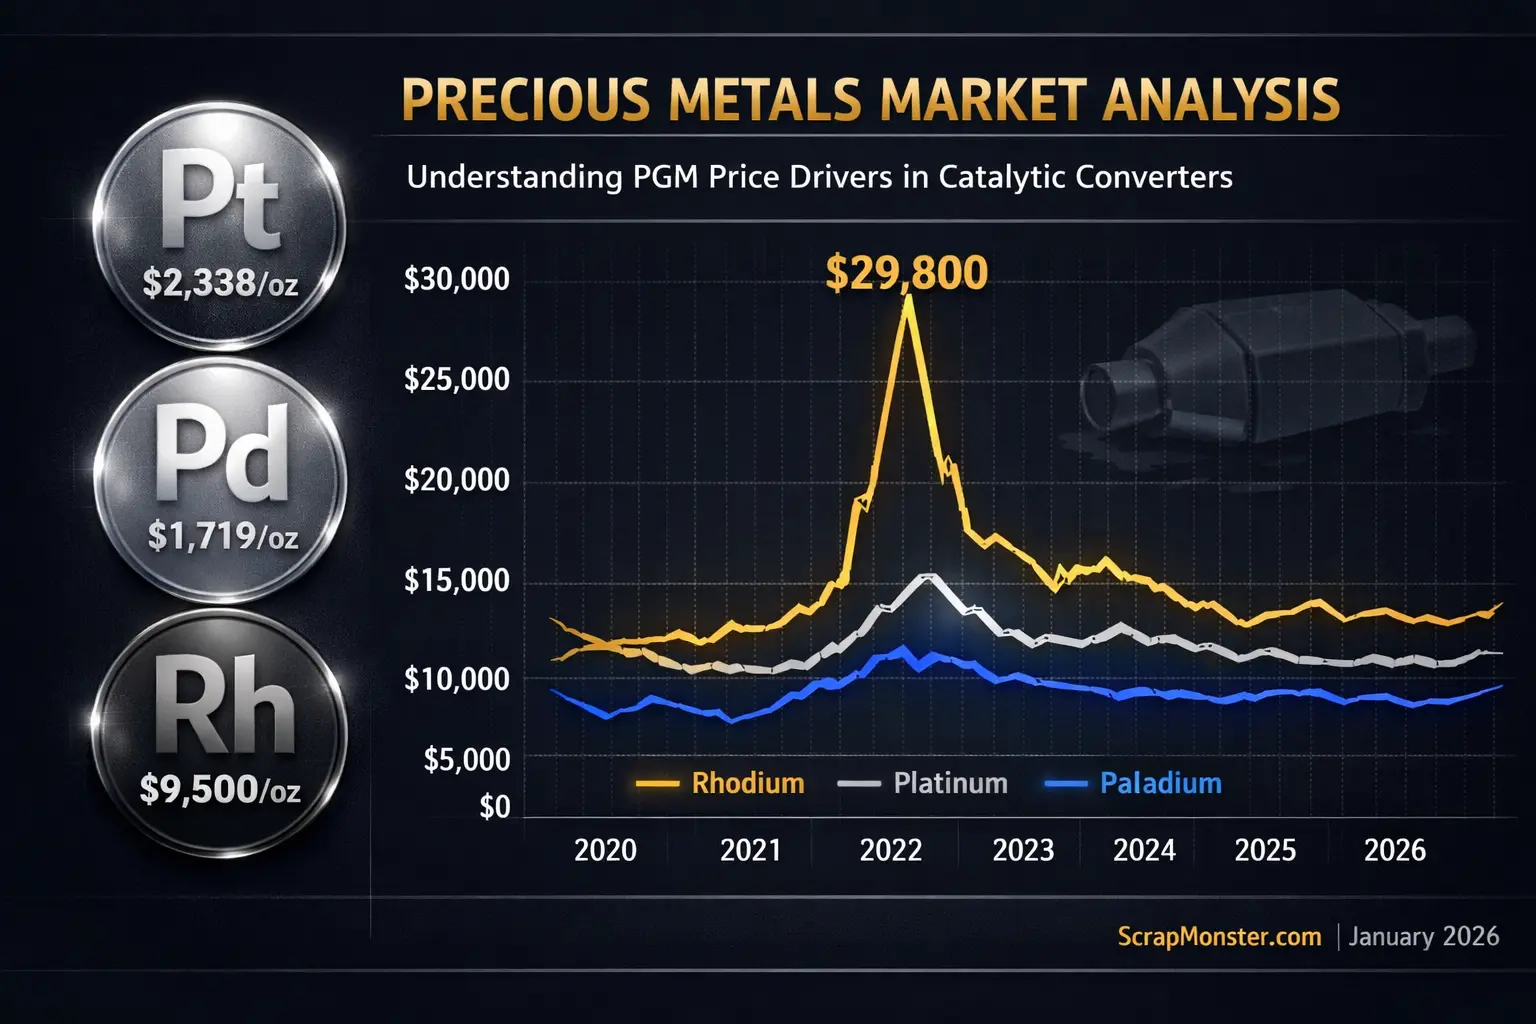
Market Context (January 2026):
- Current spot price: $9,500 per troy ounce
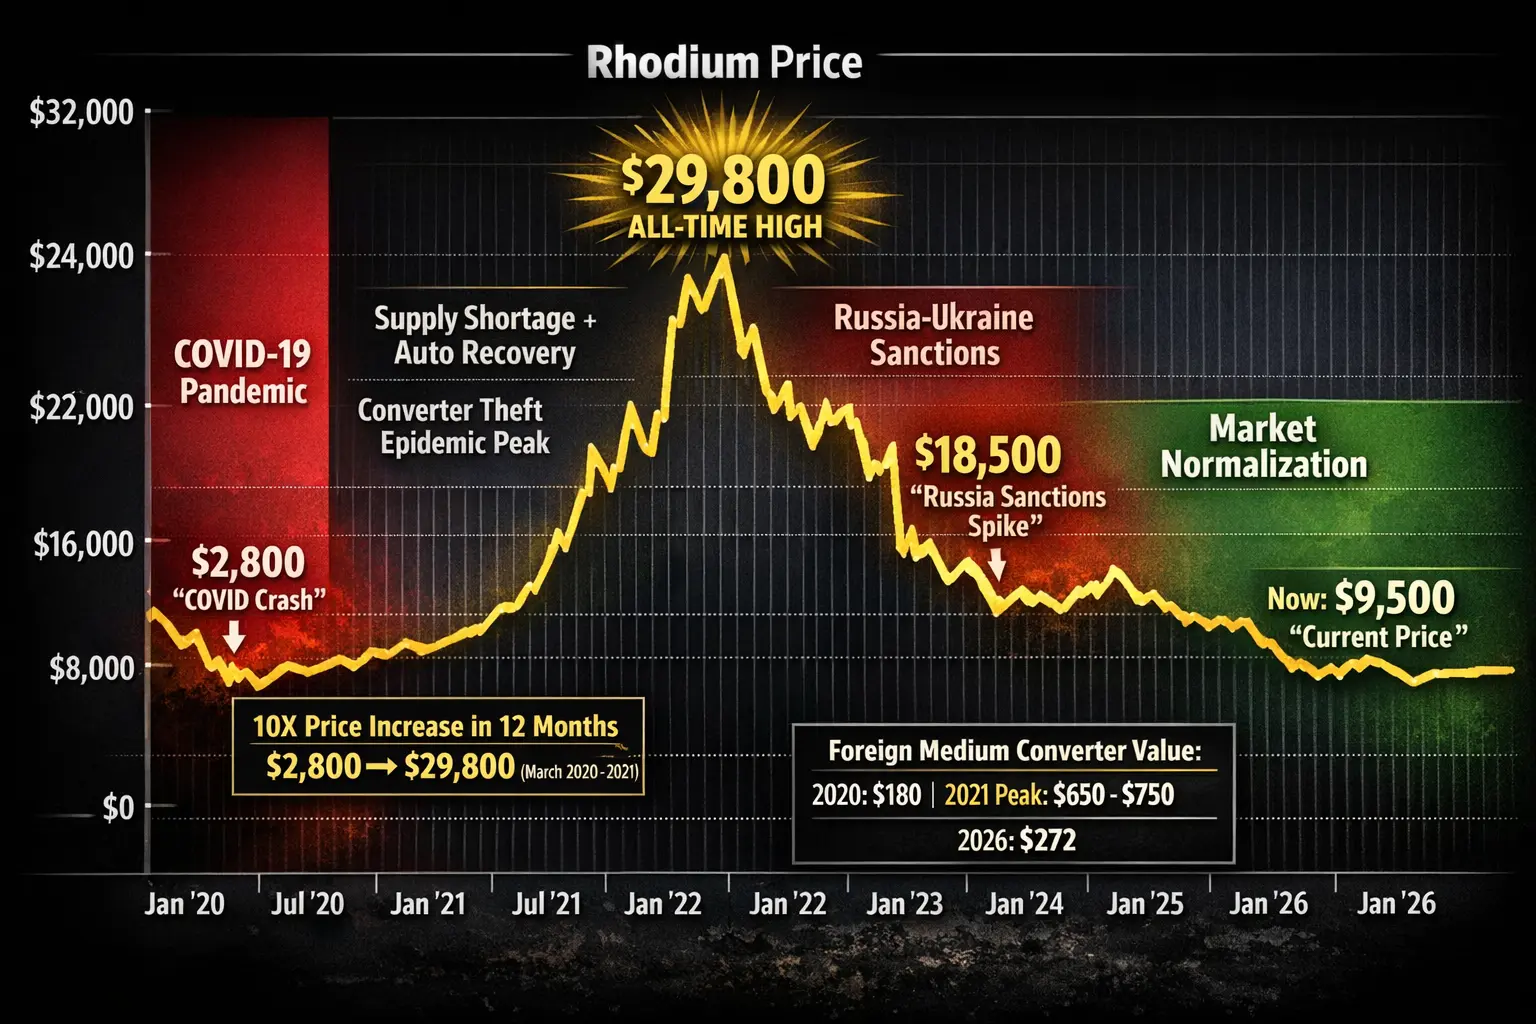
- Price range (2020-2026): Low $2,800/oz (March 2020), All-time high $29,800/oz (March 2021)
- Extreme volatility: 10X increase in 12 months (2020-2021), then 70% crash (2021-2023)
- Industrial uses: Automotive catalysts (90%), glass manufacturing (5%), other industrial (5%)
- Primary supply: 80% South Africa (near-monopoly from Bushveld Complex)
- Annual global demand: ~1 million ounces (smallest PGM market)
- Recycling contribution: 300,000-400,000 ounces annually (30-40% of supply)
Why It Matters for Scrap Value:
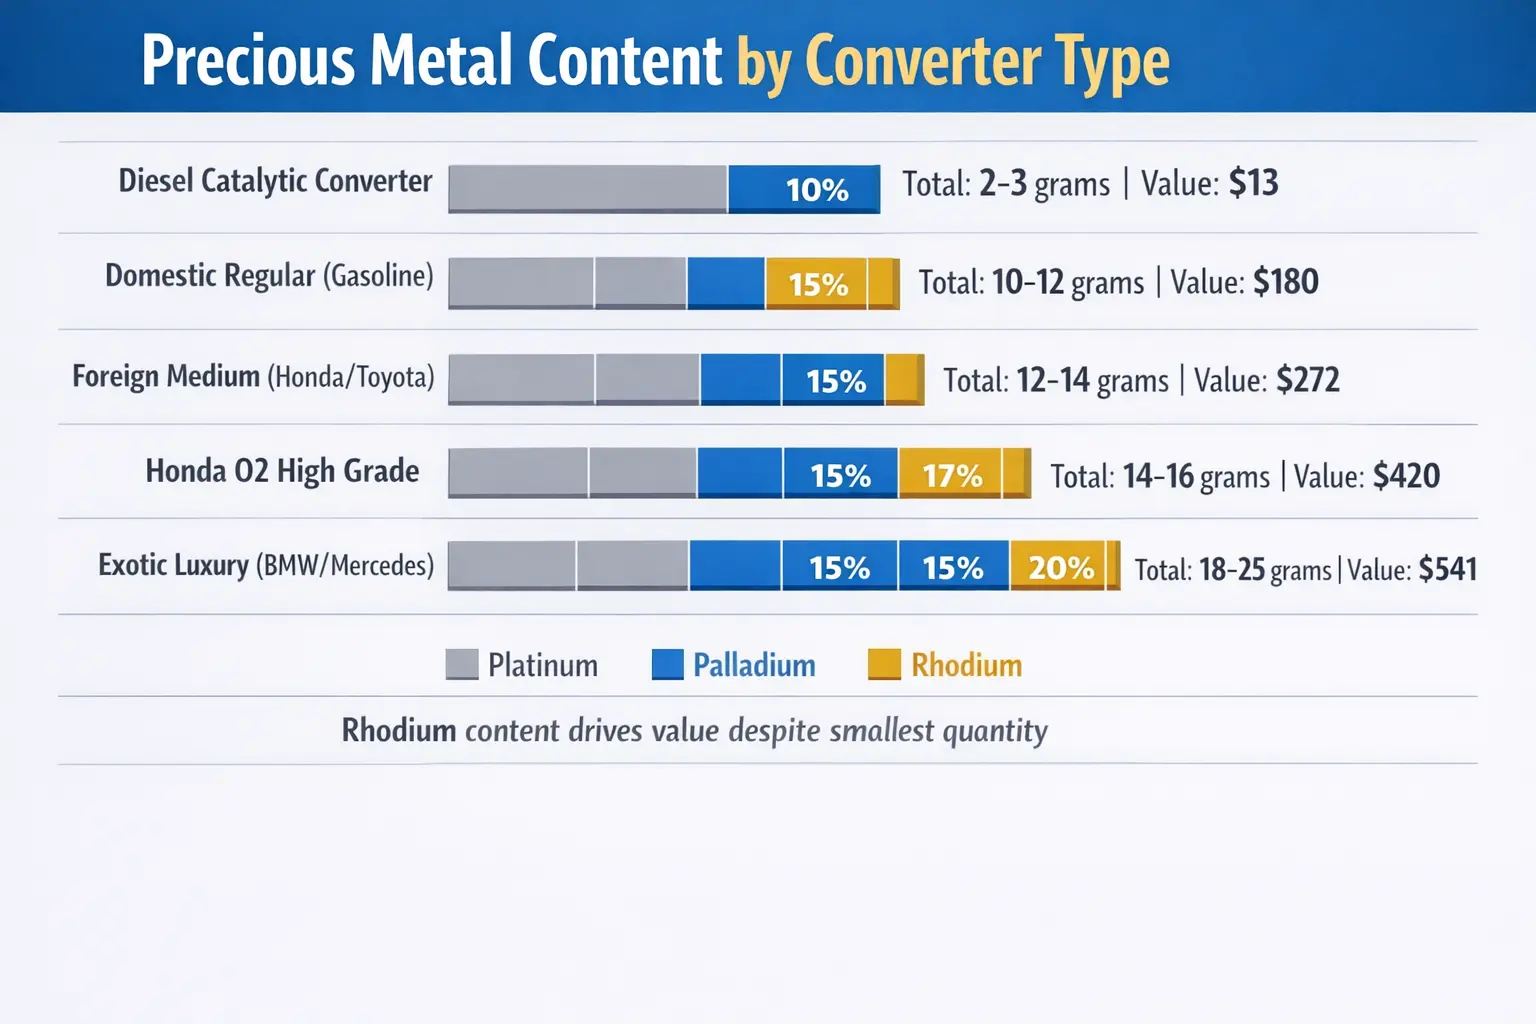
Despite representing only 10-15% of the metal content by weight, rhodium can account for 30-50% of a converter's total value due to its extraordinary price per ounce. When rhodium prices spike, converter theft rates and scrap values soar proportionally. When rhodium crashes, the entire converter market follows.
The Rhodium Effect on Converter Values:
Example: Foreign Medium Converter with 1.5g rhodium
- At $29,800/oz (2021 peak): $1,437 rhodium value alone → Converter worth $650-750
- At $9,500/oz (current): $457 rhodium value → Converter worth $272
- Price difference: 176% variation based solely on rhodium market
This explains why converter prices were 2-3X higher in 2021-2022 compared to today.
PGM Ratios: Why Converter Types Have Different Values
Three-Way Catalyst (TWC) - Gasoline Engines
Modern gasoline converters use all three PGMs in specific ratios optimized for simultaneous reduction of CO, HC, and NOx:
- Platinum: 30-35% of PGM content (oxidation of CO and HC)
- Palladium: 50-60% of PGM content (primary oxidation catalyst, especially at lower temps)
- Rhodium: 10-15% of PGM content (NOx reduction, highest value per gram)
Example: Foreign Medium Converter ($272 scrap value)
Total PGM content: ~10-12 grams
| Metal | Content | Spot Price | Calculation | Value |
|---|---|---|---|---|
| Platinum | 3-4 grams | $2,338/oz ($75/g) | 3.5g × $75 | $262 |
| Palladium | 5-6 grams | $1,719/oz ($55/g) | 5.5g × $55 | $302 |
| Rhodium | 1.5 grams | $9,500/oz ($305/g) | 1.5g × $305 | $457 |
| Total Spot PGM Value: | $1,021 | |||
| Scrap Converter Price (26.6% recovery): | $272 | |||
The difference between spot value ($1,021) and scrap price ($272) represents the five-stage value chain costs: collection, processing, milling, refining, and transaction fees totaling 65-75% of gross value.
Diesel Oxidation Catalyst (DOC)
Diesel converters use different technology with dramatically different PGM ratios:
- Platinum: 85-95% of PGM content (primary oxidation catalyst for diesel exhaust)
- Palladium: 5-15% of PGM content (secondary role in diesel applications)
- Rhodium: ~0% (diesel NOx reduction handled by SCR/DEF systems, not catalyst)
Example: Diesel Catalytic Converter ($13 scrap value)
Total PGM content: ~2-3 grams (much lower than gasoline)
| Metal | Content | Spot Price | Calculation | Value |
|---|---|---|---|---|
| Platinum | 2-3 grams | $2,338/oz ($75/g) | 2.5g × $75 | $187 |
| Palladium | 0.2-0.5 grams | $1,719/oz ($55/g) | 0.35g × $55 | $19 |
| Rhodium | 0 grams | $9,500/oz | 0g × $305 | $0 |
| Total Spot PGM Value: | $206 | |||
| Scrap Converter Price (6.3% recovery): | $13 | |||
This explains why diesel converters are the lowest-value category despite their large, impressive size and platinum content. The total PGM loading is 70-80% less than gasoline converters, and the absence of high-value rhodium dramatically reduces worth. Additionally, diesel converters have lower recovery percentages due to different substrate materials and processing challenges.
Exotic/Luxury Vehicle Converters
High-performance and luxury vehicles use premium PGM loadings to meet strict emissions while maintaining performance:
- Total PGM content: 18-25+ grams (60-100% more than standard converters)
- Higher rhodium ratios: 15-20% (vs. 10-15% in standard converters)
- Superior substrate materials: Metallic substrates for better flow and efficiency
- Multiple converters: Often 4-6 small units per vehicle rather than 1-2 large ones
Example: Exotic Catalytic Converter ($541 scrap value)
Total PGM content: ~18-20 grams
| Metal | Content | Spot Price | Calculation | Value |
|---|---|---|---|---|
| Platinum | 5-6 grams | $2,338/oz ($75/g) | 5.5g × $75 | $412 |
| Palladium | 10-11 grams | $1,719/oz ($55/g) | 10.5g × $55 | $577 |
| Rhodium | 2.5-3 grams | $9,500/oz ($305/g) | 2.75g × $305 | $839 |
| Total Spot PGM Value: | $1,828 | |||
| Scrap Converter Price (29.6% recovery): | $541 | |||
Exotic converters command better recovery percentages (27-32%) compared to standard converters because their higher total value justifies more intensive processing. The exotic category demonstrates why vehicle origin is critical for accurate valuation.
The Economics: From Spot Price to Scrap Price
Why Don't You Get Full PGM Value?
If a converter contains $1,000 worth of platinum, palladium, and rhodium at spot prices, why does it only sell for $270? Understanding the value chain explains the pricing structure that defines the catalytic converter recycling market.
The Five-Stage Value Chain
Stage 1: Collection & Grading (Scrap Dealer/Recycler)
- Margin: 5-15% of final value
- Costs: Labor, transportation, facility overhead, insurance
- Risk: Market price fluctuations during holding period (PGM prices can drop 5-10% in days)
- Services: Identification, sorting, documentation, customer service
- Competition: Multiple dealers compete, keeping margins compressed
Value remaining after Stage 1: 85-95% of starting value
Stage 2: De-Canning & Processing (Converter Processor)
- Margin: 10-15% of final value
- Costs: Cutting equipment, substrate extraction machinery, hazardous waste disposal
- Process: Removing ceramic/metallic substrate from steel housing using industrial saws/shears
- Yield loss: 2-5% from damaged or contaminated material that cannot be processed
- Environmental: EPA compliance, air filtration, waste management permits
Value remaining after Stage 2: 70-85% of starting value
Stage 3: Milling & Sampling (Material Processor)
- Margin: 5-10% of final value
- Costs: Industrial grinding equipment, assay/testing labs, quality control
- Process: Grinding substrate to uniform powder (typically <100 microns)
- Technical requirement: Achieving representative sample that accurately reflects PGM content
- Sampling: Multiple samples taken following ISO 3995 standards for precious metals
Value remaining after Stage 3: 60-80% of starting value
Stage 4: Refining (Precious Metal Refinery)
- Margin: 10-20% of final value
- Costs: Chemical processing, smelting equipment, environmental compliance, high-purity reagents
- Process: Chemical dissolution (aqua regia), separation, and purification of each metal to 99.95%+ purity
- Recovery rate: 92-98% (some metal inevitably lost in process)
- Time: 4-12 weeks from receipt to settlement
- Technology: Fire assay, ICP-MS analysis, electrochemical separation
Value remaining after Stage 4: 40-70% of starting value
Stage 5: Market Sale (Refinery to Industrial Buyer)
- Transaction costs: 1-3%
- Costs: Assay verification, logistics, market maker fees, hedging costs
- Buyers: Auto manufacturers (Johnson Matthey, BASF), jewelry manufacturers, industrial users
- Contract pricing: Typically spot price minus small discount for volume
Final value to original seller: 25-35% of spot PGM value
Total Recovery to Original Seller: 25-35% of Spot PGM Value
This explains why your $1,000 PGM-content converter sells for $270-350 at scrap price. Each stage in the value chain provides essential services—identification, processing, refining, quality assurance—while managing significant costs, risks, and regulatory compliance. The multi-stage structure is necessary because no single entity can economically perform all functions at the scale required by the automotive industry.
Why Recovery Percentages Vary:
- Higher-value converters (exotic, high-grade): 27-35% recovery (justifies intensive processing)
- Standard converters (domestic, foreign medium): 25-30% recovery (typical market rates)
- Low-value converters (diesel, aftermarket): 5-15% recovery (barely worth processing)
- Large volumes (100+ units): 30-40% via direct refinery (skip middlemen)
- Small quantities (1-20 units): 20-28% (dealers need higher margins on small lots)
Market Dynamics: What Drives PGM Prices
Supply-Side Factors
Mining Concentration Creates Vulnerability
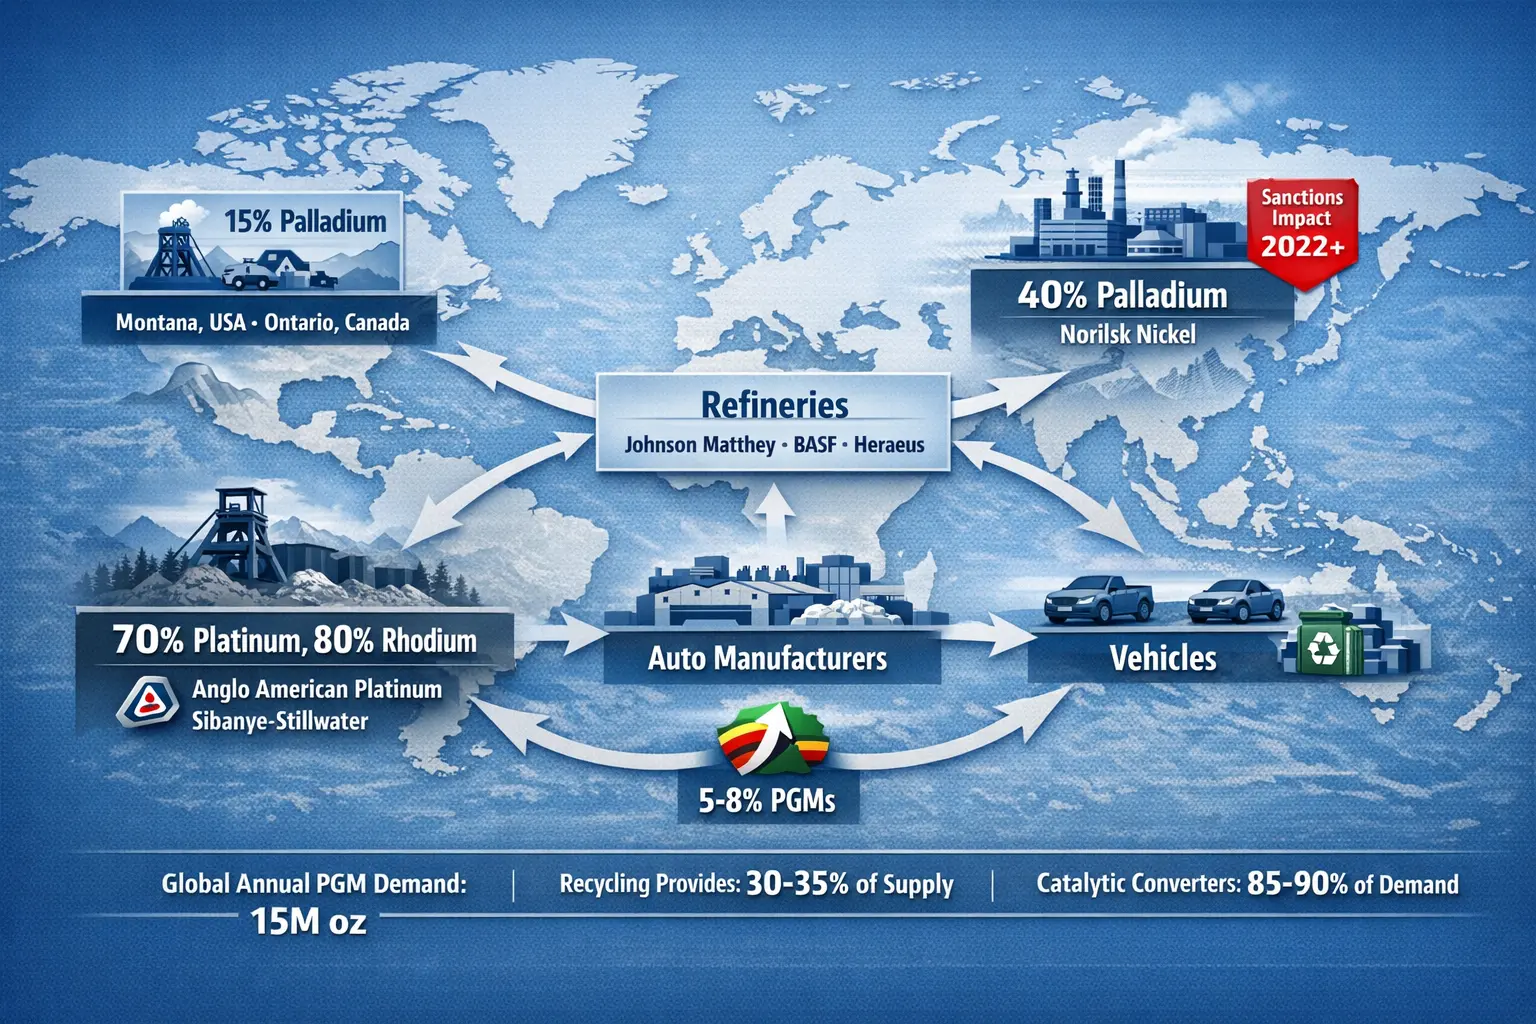
South Africa - The Platinum Powerhouse
- Share of global supply: 70-80% of platinum and rhodium, 35-40% of palladium
- Key deposits: Bushveld Complex (largest PGM reserve on Earth)
- Major producers: Anglo American Platinum (Amplats), Sibanye-Stillwater, Impala Platinum
- Challenges: Deep mines (1-2 km underground), high costs, labor disputes, power shortages (Eskom)
- Recent disruptions: 2023 strikes shut down 30% of production for 4 months
Russia - Palladium Dominance
- Share of global supply: 40-45% of palladium, 10-15% of platinum
- Key producer: Norilsk Nickel (world's largest palladium producer)
- Production type: By-product of nickel/copper mining in Siberia
- Sanctions impact: 2022-present Ukraine conflict disrupted exports, spiked palladium to $3,440/oz
- Current status: Exports resumed to China/India but Western buyers remain cautious
North America - Growing Share
- Share of global supply: 15% of palladium, 5% of platinum
- Key operations: Stillwater Mine (Montana), Sudbury Basin (Ontario)
- Advantage: Politically stable, but higher production costs than South Africa
- Growth: Expansion projects responding to geopolitical diversification demand
Zimbabwe - Emerging Producer
- Share of global supply: 5-8% of PGMs (growing rapidly)
- Deposits: Great Dyke (similar geology to South Africa's Bushveld)
- Challenges: Political instability, infrastructure gaps, investment uncertainty
- Potential: Could reach 10-15% of global supply by 2030
Geopolitical Risk = Price Volatility
The extreme concentration of PGM production means political events immediately impact global prices:
Russia-Ukraine Sanctions (February 2022)
Disrupted 40% of global palladium supply overnight. Palladium spiked from $2,200/oz to $3,440/oz in days. Foreign Medium converters jumped from $280 to $390+. Auto manufacturers scrambled to secure alternative supply and accelerate platinum-for-palladium substitution.
South African Mining Strikes (2012, 2014, 2019, 2023)
Labor disputes in Bushveld mines repeatedly disrupted 20-40% of platinum/rhodium supply. The 2023 strike (4 months) contributed to rhodium maintaining $10,000+ pricing despite declining automotive demand. Each strike episode creates 6-12 month supply deficit due to production restart delays.
COVID-19 Pandemic (March 2020)
South African lockdowns shuttered mines, dropping PGM supply 30%. Combined with automotive demand collapse, prices initially crashed (rhodium to $2,800), then skyrocketed as production recovered slower than demand (rhodium to $29,800 by March 2021). The whipsaw created unprecedented converter price volatility.
For recyclers: Geopolitical news from South Africa and Russia should trigger immediate review of inventory and pricing strategy. PGM prices can move 10-20% within 48 hours of major political events.
Mining Economics: Why Supply Can't Quickly Respond
- Long development cycles: New mines take 5-10 years from discovery to production
- High capital requirements: $1-3 billion investment for major PGM mine
- Declining ore grades: South African mines extracting progressively lower-grade ore (more mining for same output)
- Deep mining challenges: Bushveld mines now 1.5-2 km deep, increasing costs and risks
- By-product nature: Much palladium comes from nickel/copper mining; PGM prices alone don't drive production decisions
- Ramp-up delays: Even existing mines take 6-12 months to increase production after price spikes
This inelastic supply is why PGM prices experience such dramatic volatility—supply cannot quickly respond to demand changes, forcing price to equilibrate the market.
Demand-Side Factors
Automotive Industry: The 800-Pound Gorilla
The automotive sector dominates PGM demand, consuming 85-90% of annual production. Understanding automotive trends is essential for forecasting converter values.
Global Vehicle Production Drives Baseline Demand
- Annual production (2025): 82-85 million light vehicles globally
- PGM per vehicle: 10-20 grams average (varies by region and emissions standards)
- Regional variations: European vehicles use 20-30% more PGMs than North American due to diesel preference
- Growth markets: China (28M vehicles), India (5M vehicles), Southeast Asia (4M vehicles)
Stricter Emissions Standards = Higher PGM Loading
Each tightening of emissions regulations requires more precious metals per vehicle:
- Euro 7 (Europe, 2025): 30-40% stricter NOx limits = 25-35% more rhodium per vehicle
- China 6B (2023+): Approaching European strictness, dramatically increased PGM demand from world's largest auto market
- EPA Tier 3 (USA, ongoing): 70% reduction in NOx fleet average by 2025 = higher catalyst loading
- India BS-VII (2027+): Major upgrade from BS-VI requiring modern three-way catalysts
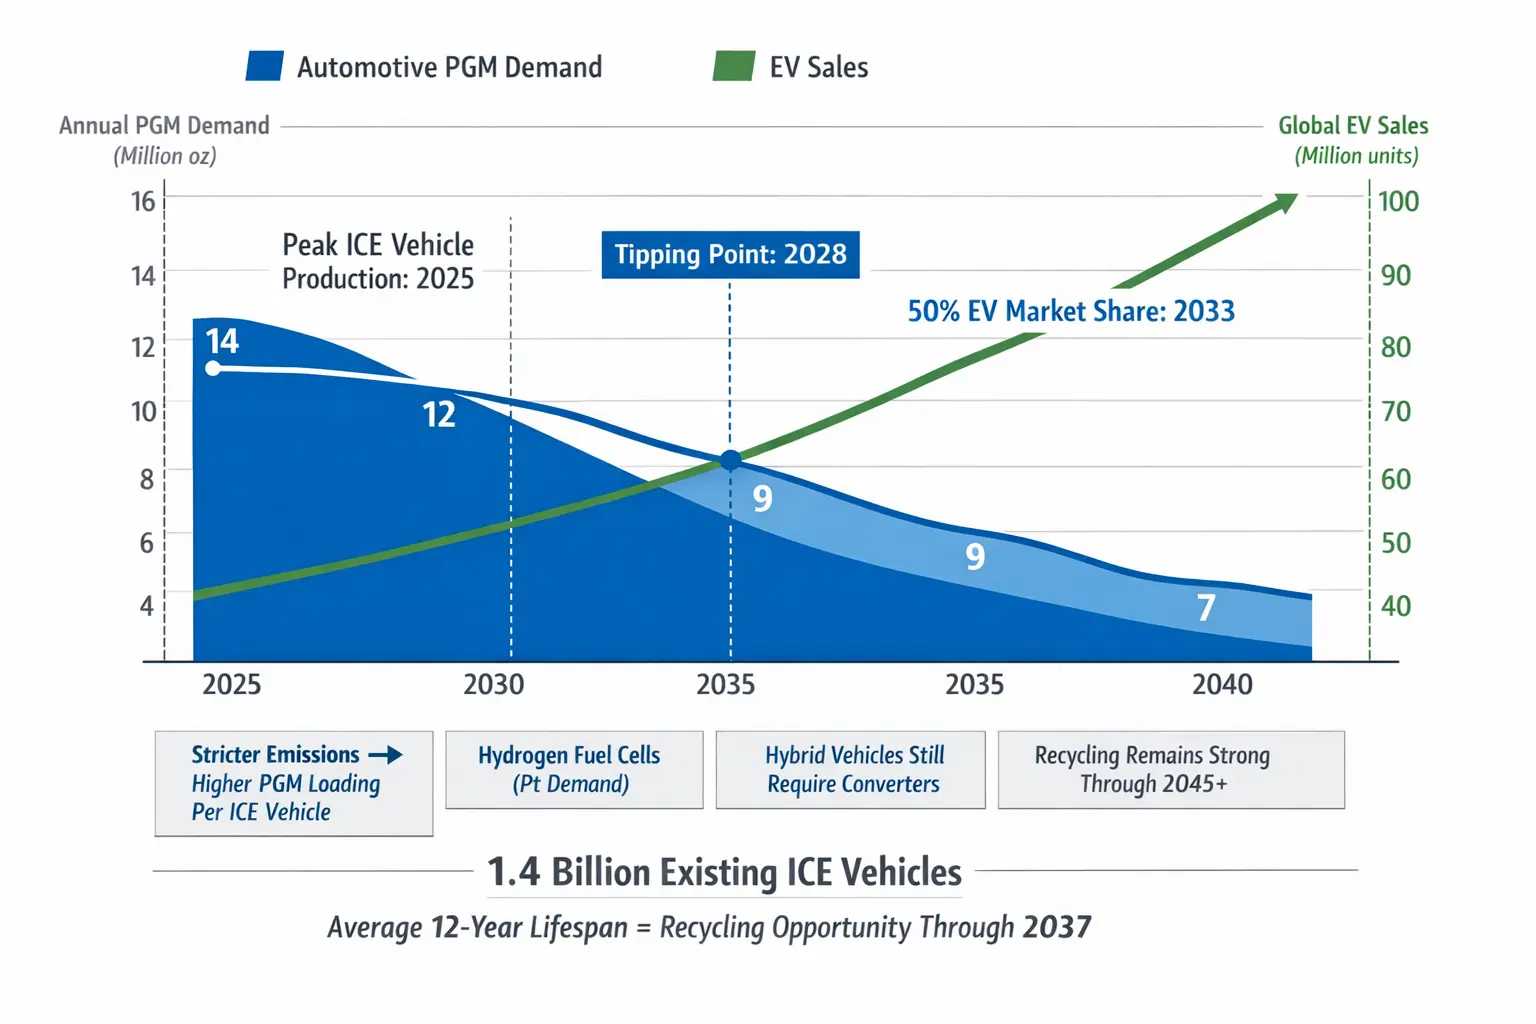
This creates a paradox: Even as EV adoption grows, remaining ICE vehicles require MORE PGMs per unit, partially offsetting demand decline.
The EV Transition: Existential Threat or Gradual Shift?
Current Reality (2026):
- EVs: ~18 million units (21% of global sales)
- ICE vehicles: ~64 million units (79% of sales, all need converters)
- Hybrids: ~8 million units (still require catalytic converters)
Projected Impact (2030):
- EVs: 40-45 million units (45-50% of sales)
- ICE/Hybrid: 40-45 million units (50-55% of sales)
- Net effect: Automotive PGM demand down 15-20% from 2025 peak
Long-term Outlook (2035-2040):
- EVs: 65-75 million units (75-80% of sales)
- ICE/Hybrid: 15-20 million units (20-25% of sales)
- Net effect: Automotive PGM demand down 40-60% from peak
- However: 1.4 billion existing ICE vehicles provide recycling supply through 2045+
Recycling: The Critical Secondary Supply
Catalytic converter recycling is not a side industry—it's a fundamental pillar of global PGM supply:
- Annual converter recycling: 1.2-1.5 million ounces PGMs recovered
- Percentage of supply: 30-35% of total global PGM availability
- Growth trajectory: Rising as vehicle fleet ages and recycling infrastructure improves
- Geographic leaders: North America and Europe (mature markets, high scrap rates)
- Emerging markets: China recycling growing 20%+ annually as vehicle fleet matures
Why Recycling Matters More Than Ever:
- Environmental: Recycling uses 10X less energy than primary mining
- Economic: Equivalent to output of 3-4 large platinum mines annually
- Supply security: Domestic recycling reduces geopolitical dependence
- Circular economy: Old converter → refining → new converter creates closed loop
- Price stability: Recycled supply helps dampen extreme price volatility
As primary mining becomes more difficult and expensive, recyclers become increasingly vital to automotive supply chains. Your role in the converter recycling market directly supports global manufacturing and environmental sustainability.
Industrial & Investment Demand
Beyond Automotive: Growing Industrial Uses
- Hydrogen fuel cells (platinum): 50-80 grams per vehicle (vs. 3-7g in converters). If hydrogen economy develops, could offset automotive catalyst decline
- Glass manufacturing (rhodium): LCD screens, fiber optics, high-temperature applications
- Chemical industry (platinum, palladium): Industrial catalysis, pharmaceutical manufacturing
- Electronics (palladium): Multilayer ceramic capacitors (MLCCs) in smartphones, computers
- Dental/medical (palladium, platinum): Alloys, medical devices, cancer treatments
Investment Demand: The Wild Card
During 2020-2022 PGM price spikes, investment demand surged:
- ETFs: Aberdeen Physical Palladium Shares (PALL), abrdn Physical Platinum Shares (PPLT)
- Physical holdings: Investors accumulated rhodium sponge, platinum bars during price run-ups
- Speculation: Hedge funds took large positions in PGM futures
- Impact on prices: Investment buying added 10-20% to peak prices, then reversed violently
Investment flows create additional volatility but represent <5% of total demand during normal markets.
The Substitution Factor: Natural Price Ceiling
Automakers constantly work to reduce expensive PGM content, creating natural price resistance:
Palladium-for-Platinum (Early 2000s)
When platinum exceeded $2,000/oz and palladium was $200/oz, automakers shifted gasoline converters from platinum-heavy to palladium-heavy formulations. This is why post-2000 converters have different ratios than 1990s units.
Platinum-for-Palladium (2021-2022)
When palladium spiked to $3,000/oz while platinum was $1,000/oz, manufacturers reversed the substitution, shifting back toward platinum. This cyclical substitution creates long-term price convergence between Pt and Pd.
Total Loading Reduction (Ongoing)
Advanced substrate designs, better washcoat adhesion, and optimized PGM dispersion allow manufacturers to reduce total loading by 10-20% while meeting same emissions targets. Each generation of converters uses less PGM per unit of emissions reduction.
This creates a "price ceiling" effect: When PGM prices get too high, manufacturers find ways to use less, which eventually brings prices down. This is why sustained prices above $3,000/oz palladium or $15,000/oz rhodium trigger aggressive substitution and thrifting, preventing even higher peaks.
Price Volatility: The Converter Recycler's Challenge and Opportunity
Historical Price Ranges (2020-2026)
What This Means for Converter Prices
The PGM price volatility directly translates to converter value swings that create both risk and opportunity:
Peak Pricing Period (March 2021 - Rhodium at $29,800/oz)
| Converter Type | Current Price (Jan 2026) | Peak Price (March 2021) | Difference |
|---|---|---|---|
| Foreign Medium | $272 | $650-750 | +139-176% |
| Exotic | $541 | $1,200-1,500 | +122-177% |
| Torpedo High Grade | $832 | $1,800-2,200 | +116-164% |
| Honda O2 High Grade | $420 | $900-1,100 | +114-162% |
| Domestic Regular | $180 | $380-450 | +111-150% |
The 2021-2022 Boom: What It Taught Us
The dramatic price spike made national news because of its cascading effects:
1. Converter Theft Epidemic
- Statistics: Thefts increased 1,200% nationally (2019: 3,500 → 2021: 52,000+)
- Target vehicles: Toyota Prius, Honda Element, trucks/SUVs (high-value, easy access)
- Economic impact: $3+ billion in victim replacement costs (2021-2023)
- Legislative response: 45+ states enacted converter-specific theft laws
2. Exceptional Recycler Profits
- Professional recyclers saw 2-3X normal profit margins
- Inventory held during the spike yielded 50-150% gains
- Created new market entrants and increased competition
- Established recyclers expanded operations and hired staff
3. Law Enforcement Crackdowns
- FBI task forces targeting theft rings
- Undercover stings at scrap yards
- RICO prosecutions of organized theft operations
- Hundreds of arrests, tens of millions in seized assets
- Increased scrutiny of all converter transactions
4. Regulatory Tightening
- Mandatory ID requirements for all sales
- VIN documentation mandates in many states
- Holding periods (3-30 days by jurisdiction)
- Transaction photo/video documentation required
- Increased penalties for buying stolen converters
Key Lesson: Extreme PGM price volatility creates extraordinary opportunities but also brings increased regulatory scrutiny, competition, and legal risks. The most successful recyclers during the boom maintained rigorous documentation and ethical sourcing standards that protected them when enforcement intensified.
Trading Strategies for Recyclers
Understanding PGM volatility allows strategic inventory management:
Conservative Approach: Minimize Risk
- Strategy: Sell immediately upon acquisition
- Advantages: No market risk, steady cash flow, predictable returns
- Disadvantages: Miss potential price gains
- Best for: Small operators, limited working capital, risk-averse businesses
- Expected returns: Market rate (25-30% of spot PGM value)
Moderate Approach: Tactical Timing
- Strategy: Hold inventory 2-4 weeks, watch daily PGM prices
- Sell triggers: Prices spike 5-10%, news of supply disruption, peak reached
- Advantages: Balance risk vs. opportunity, capture short-term movements
- Disadvantages: Requires working capital, market monitoring time
- Best for: Mid-size operators processing 50-200 converters/month
- Expected returns: 28-35% of spot PGM value (3-5% better than immediate sale)
Aggressive Approach: Strategic Positioning
- Strategy: Hold inventory 1-3 months during price dips, sell during spikes
- Buy signals: PGMs down 15%+ from recent peaks, geopolitical stability
- Sell signals: PGMs up 20%+ from lows, supply disruption news, technical resistance
- Advantages: Potential for 20-50% additional returns during volatile periods
- Disadvantages: High working capital needs, significant downside risk, requires expertise
- Best for: Large operators with $100K+ inventory capacity and market knowledge
- Expected returns: 30-40% of spot PGM value (or losses if market moves against position)
Risk Management Principles:
- Never hold inventory you can't afford to sell at current prices - PGMs can drop 10-20% in days
- Diversify converter types - Don't concentrate in rhodium-heavy categories during peaks
- Set stop-loss levels - If rhodium drops below $8,000, sell immediately regardless of original plan
- Consider hedging for large inventories - PGM futures can protect six-figure positions
- Maintain relationships with multiple buyers - Ensures competitive pricing when you need to liquidate
- Document timing rationale - Helps refine strategy over time and explains decisions to stakeholders
Environmental & Sustainability Context
Why Catalytic Converter Recycling Matters
Your work in converter recycling is not just profitable—it's environmentally essential and economically significant to global supply chains.
Resource Conservation
- Energy savings: Recycling PGMs uses 10X less energy than primary mining
- Avoided mining: Each recycled converter = 0.3-0.5 ounces PGMs returned to supply
- Annual impact: Converter recycling prevents mining equivalent to 3-4 large platinum mines
- Land preservation: Reduces need for destructive open-pit mining and deep shaft operations
- Water conservation: PGM mining requires massive water usage; recycling eliminates this
Economic Efficiency
- Circular economy: Old converter → refined metal → new converter creates closed loop
- 100% recyclability: PGMs can be recycled infinitely with no quality degradation
- Chemical equivalence: Recycled PGMs are identical to newly mined material
- Cost effectiveness: Recycling is economically competitive with primary production
- Supply security: Reduces dependence on geopolitically unstable mining regions
Emissions Impact
- CO₂ reduction: Recycling prevents 5-10 tons CO₂ emissions per ounce of PGM vs. mining
- Equivalent benefit: Every converter recycled = taking a car off the road for 1-2 months
- Mining emissions: Deep underground mining is energy-intensive (electricity, diesel, blasting)
- Transportation: Local recycling reduces shipping emissions vs. South African imports
Social Responsibility
- Reduces mining dependence: Less reliance on deep, dangerous mining operations
- Creates domestic jobs: Processing, refining, analysis positions in recycling sector
- Supports circular economy: Aligns with global sustainability goals and ESG investing
- Combats illegal mining: Legal recycling provides alternative supply to artisanal/illegal operations
By the Numbers: Your Impact
If you process 500 converters per month averaging 12g PGM content:
- Annual PGM recovery: 72,000 grams (2,314 troy ounces)
- Equivalent mining avoided: Processing 18-25 tons of ore
- Energy saved: ~115,000 kWh (equivalent to 10 US homes for a year)
- CO₂ prevented: ~115 metric tons (equivalent to 25 cars off road for a year)
- Economic value: $4-5 million in PGM spot value returned to manufacturing supply chain
Your recycling operation has measurable environmental and economic impact at scale. This sustainability story is valuable for business development and community relations.
Future Trends: What's Coming in the PGM Market
Electric Vehicle Impact (2025-2035)
The EV Transition Challenge
Electric vehicles require zero catalytic converters, creating an existential question for PGM demand:
2025-2028: Peak Demand Period
- ICE production: Still 60-65 million units annually (peak levels)
- Emissions regulations: Euro 7, China 6b drive higher PGM loading per vehicle
- Replacement market: 2010-2015 vehicles (high-mileage converters) entering recycling stream
- Net effect: PGM demand remains strong, possibly peaks in 2026-2027
- Price outlook: Support at current levels, potential for spikes on supply disruptions
2028-2035: Transition Period
- EV sales: Cross 50% market share globally (~2032-2033)
- ICE production: Declining 5-8% annually to 35-40 million units by 2035
- PGM per vehicle: Increasing 20-30% as remaining ICE vehicles meet strictest-ever emissions
- Net effect: Demand down 15-25% from peak, but not catastrophic
- Price outlook: Gradual decline with volatility around supply shocks
2035-2045: Mature EV Market
- EV sales: 70-80% of new vehicle sales
- ICE production: 15-20 million units ( niche markets, commercial, emerging economies)
- Recycling dominance: 1.4 billion existing ICE vehicles provide robust recycling supply through 2045+
- Net effect: New converter demand down 60-70%, but recycling remains strong
- Price outlook: Lower price floor, but specialty converters maintain value
Mitigating Factors: Why Demand Won't Disappear
- Existing fleet longevity: 1.4 billion ICE vehicles averaging 12-15 year lifespan = recycling through 2045+
- Emerging markets: India, Africa, Southeast Asia will continue ICE production longer (affordability, infrastructure)
- Hybrid vehicles: Still require catalytic converters, will be 15-20% of market through 2040
- Commercial/heavy-duty: Trucks, buses, construction equipment slower to electrify
- Stricter regulations: Remaining ICE vehicles face toughest-ever emissions standards
- Used vehicle exports: Developed world ICE vehicles exported to emerging markets extend life
Hydrogen Fuel Cells: Potential Game-Changer
Hydrogen fuel cell vehicles (FCVs) could stabilize or even increase platinum demand:
The Platinum Opportunity
- FCV platinum content: 50-80 grams per vehicle (vs. 3-7g in catalytic converters)
- Function: Platinum catalyzes hydrogen-oxygen reaction in fuel cell stack
- Current adoption: Minimal (<50,000 FCVs globally, mostly Japan/California)
- Infrastructure challenge: Hydrogen refueling stations expensive, limited availability
- Commercial focus: Heavy-duty trucks, buses, trains more viable than passenger cars
If Hydrogen Economy Develops
Optimistic scenario (10-15% of vehicle fleet by 2040):
- 10-12 million FCVs annually × 60g platinum = 600,000-720,000 oz annual demand
- This would offset 40-50% of automotive catalyst demand lost to EVs
- Platinum prices would strengthen relative to palladium and rhodium
- Platinum could trade at premium to palladium again
Realistic scenario (2-5% of fleet by 2040):
- 2-4 million FCVs annually = 120,000-240,000 oz platinum demand
- Helpful but not transformative for platinum market
- Most impact in commercial/heavy-duty segments
Bottom line: Hydrogen FCVs are more likely to stabilize platinum demand than fully replace automotive catalyst losses. Rhodium and palladium have no comparable new applications and face steeper long-term declines.
Emission Standards: The Near-Term Demand Driver
While EVs threaten long-term demand, near-term regulations drive it higher:
Euro 7 (Europe, 2025+)
- NOx limits: 30-40% stricter than Euro 6
- Impact: 25-35% more rhodium per vehicle required
- Coverage: All new vehicles sold in EU (12-13 million annually)
- Timeline: Phase-in 2025-2027, full compliance by 2027
China 6B (2023+)
- Stringency: Approaching European levels (major upgrade from China 5)
- Impact: 40-60% higher PGM loading vs. previous standard
- Coverage: World's largest auto market (28 million vehicles annually)
- Significance: Doubled Chinese PGM demand within 2 years
EPA Tier 4 (USA, ongoing)
- Focus: Heavy-duty diesels, non-road equipment
- Impact: Large converters with 15-30g PGM content
- Coverage: Construction, agriculture, marine engines
- Recycling opportunity: Commercial converters highly valuable
India BS-VII (2027+)
- Leap forward: Major upgrade requiring modern three-way catalysts
- Market size: 5 million vehicles annually, growing 8-10%
- Impact: New demand source as India modernizes fleet
These regulations ensure strong PGM demand through at least 2030, giving the converter recycling industry a decade-plus of robust activity even as EV adoption accelerates.
Conclusion: Knowledge Creates Competitive Advantage
Understanding precious metals in catalytic converters transforms your approach from simple scrap trading to sophisticated commodities management. Every converter you handle represents a complex mix of platinum, palladium, and rhodium—metals that power the global automotive industry, support critical industrial processes, and trade as investment assets across international markets.
Key Insights to Remember
1. The 25-35% Rule
Scrap prices reflect 25-35% of spot PGM value after accounting for processing, refining, risk, and profit margins throughout the five-stage value chain. This isn't exploitation—it's the legitimate cost of transforming a used converter into refined metals ready for manufacturing.
2. Rhodium Drives Volatility
Despite being the smallest component by weight (1-2g), rhodium's extreme price swings create the biggest opportunities and risks in converter recycling. When rhodium moves 20%, converter values follow proportionally. Monitor rhodium daily.
3. Vehicle Age and Type Matter Enormously
Post-2000 converters typically have higher palladium content than pre-2000 units (platinum-heavy). Exotic luxury vehicles contain 60-100% more PGMs than standard vehicles. Diesel converters have 70% less PGM content than gasoline units despite larger size.
4. PGM Prices Are Global Commodities
Events in South Africa, Russia, and global automotive production directly impact your local converter prices within days. Subscribe to Kitco.com price alerts and monitor Bloomberg Commodities for market-moving news.
5. Recycling Is Mission-Critical
With EV adoption growing and primary mining becoming more difficult, maximizing recovery from existing converters is increasingly important for global PGM supply. Your recycling operation provides 30-35% of global PGM availability—you're not just a scrap dealer, you're a critical link in automotive supply chains.
6. Timing Is Everything
Weekly price monitoring and strategic selling can improve returns by 15-30% compared to immediate liquidation. Sell when rhodium exceeds $10,000/oz, palladium tops $1,800/oz, or any PGM spikes 5%+ in a week.
7. The Future Is Gradual, Not Immediate
EV adoption will reduce converter demand 40-60% by 2040, but the existing 1.4 billion ICE vehicle fleet ensures robust recycling opportunities through 2045+. Plan for gradual evolution, not sudden collapse. The converter recycling business has 20+ years of viability ahead.
Taking Action
Immediate Actions (This Week):
- Bookmark ScrapMonster precious metals prices for daily checking
- Set up price alerts: Rhodium >$10,000, Palladium >$1,800, Platinum >$1,200
- Review your recent converter sales—calculate actual PGM recovery percentage
- Identify which converter categories you process most frequently
This Month:
- Build relationships with 3+ verified buyers and compare settlement terms
- Start tracking PGM price movements vs. your converter quotes (correlation analysis)
- Calculate your inventory value at current spot prices vs. scrap prices
- Review your documentation practices for legal compliance
This Quarter:
- Consider XRF analyzer investment if processing 500+ converters monthly
- Develop relationships with direct refineries for high-value inventory
- Implement formal inventory management system with PGM content tracking
- Create strategic plan for EV transition (2025-2035 outlook)
This Year:
- Optimize your converter identification skills (refer to Identification Guide)
- Expand buyer network to include regional and national options
- Consider hedging strategies if holding $50K+ inventory regularly
- Stay current on regulatory changes and compliance requirements
Frequently Asked Questions
Precious Metal Basics
Q: Why can't automakers use cheaper metals instead of PGMs in catalytic converters?
A: Fifty years of research have failed to find alternatives that can withstand 400-800°C exhaust temperatures while catalyzing oxidation and reduction reactions for 100,000+ miles. Base metals (iron, copper, nickel) corrode, degrade, or poison under these conditions. Only platinum, palladium, and rhodium possess the unique combination of heat resistance, chemical stability, and catalytic efficiency required. This is why PGMs remain irreplaceable despite costing $1,700-$9,500 per ounce.
Q: How do refineries separate platinum, palladium, and rhodium from each other?
A: The refining process uses selective dissolution and precipitation chemistry. The ground substrate is dissolved in aqua regia (mixture of nitric and hydrochloric acids), then each metal is separated through pH-controlled precipitation, solvent extraction, or ion exchange. Platinum typically precipitates as ammonium chloroplatinate, palladium as palladium dimethylglyoxime, and rhodium through hydroxide precipitation. Final purification uses electrochemical refining or chemical reduction to achieve 99.95%+ purity for each metal. This complex process takes 4-12 weeks and explains much of the value chain cost.
Q: Do platinum, palladium, and rhodium have different recycling rates?
A: Yes, recovery rates vary by metal and processing method. Platinum: 96-98% recovery (most stable, easiest to refine). Palladium: 94-97% recovery (slightly more challenging due to chemical properties). Rhodium: 92-95% recovery (most difficult, requires specialized chemistry). Overall converter recovery averages 94-96%, meaning 4-6% of PGM content is lost during processing—one reason why scrap prices are significantly below spot values.
Q: Can I test precious metal content at home without expensive equipment?
A: Not accurately. Home testing methods (acid tests, density measurements, magnet tests) cannot reliably measure microscopic PGM coatings on ceramic substrates. Professional identification requires either: (1) XRF analyzers ($15K-45K) for instant readings with ±5-10% accuracy, or (2) assay settlement through refineries (4-12 weeks, most accurate). For practical purposes, use the Identification Guide methods (serial numbers, vehicle origin, weight, size) which reliably predict PGM content within 15-20% without equipment investment.
Market Pricing & Valuation
Q: Why do converter prices change weekly on ScrapMonster?
A: ScrapMonster converter prices are updated weekly to reflect current precious metal spot prices. When rhodium increases $500/oz, a Foreign Medium converter with 1.5g rhodium gains ~$24 in PGM value, translating to $6-8 higher scrap price (at 25-35% recovery). Our weekly updates ensure pricing reflects current market conditions, unlike competitors who may update monthly or irregularly.
Q: How can I calculate the PGM value in my converter?
A: Step 1: Identify converter category using the Identification Guide. Step 2: Estimate PGM content (gasoline converters: 10-15g total, exotic: 18-25g, diesel: 2-3g). Step 3: Check current spot prices for platinum ($2,338/oz = $75/g), palladium ($1,719/oz = $55/g), rhodium ($9,500/oz = $305/g). Step 4: Calculate total PGM value. Step 5: Multiply by 25-35% to estimate scrap price. Example: 12g total PGM = 3.5g Pt ($262) + 6g Pd ($330) + 1.5g Rh ($457) = $1,049 spot value × 27% = ~$283 scrap price.
Q: Why do some buyers offer 30% of spot value while others offer only 20%?
A: Higher-paying buyers typically have: (1) Direct refinery relationships eliminating middleman margins, (2) High-volume operations achieving economies of scale, (3) Efficient processing reducing per-unit costs, (4) Access to working capital allowing them to hold inventory and time sales. Scrap buyers offering only 20% may be small-volume operators with higher overhead, distant refineries, or conservative business models. Always get quotes from 3+ buyers—the difference on $100K annual sales can exceed $10,000.
Q: How do I know if I'm getting a fair price for my converters?
A: Step 1: Know your converter's category and approximate PGM content. Step 2: Calculate spot value using current PGM prices. Step 3: Fair scrap price should be 25-35% of spot value (higher for exotic/high-volume, lower for diesel/small quantities). Step 4: Get quotes from 3+ verified ScrapMonster buyers. Step 5: Compare quotes to each other and to calculated fair value. If all three quotes are within 5-10% of each other and within expected range, pricing is likely fair. Beware quotes 20%+ below others (lowball) or 30%+ above (potential scam/bait-and-switch).
Q: Can PGM prices move significantly in a single day?
A: Yes, especially rhodium and palladium. Major geopolitical events, mining strikes, or supply announcements can move prices 5-15% within 24 hours. During the 2022 Russia sanctions, palladium jumped $400/oz (18%) in a single day. This is why timing matters—selling the day before a 10% drop costs you significantly. Monitor prices daily via Kitco or Bloomberg and act when you see major movements.
Supply & Demand Dynamics
Q: What would happen if South African mines shut down completely?
A: Catastrophic price spike. South Africa produces 70-80% of global platinum and rhodium. Complete shutdown would eliminate ~6 million oz platinum and 700,000 oz rhodium from annual supply. Prices would likely spike 200-500% within weeks as automakers, refineries, and investors scramble for alternative supply. Converter values would soar proportionally. However, this scenario is unlikely—even during COVID lockdowns and major strikes, South African production continued at reduced levels. More realistic concern is gradual production declines due to aging mines and declining ore grades.
Q: How long does it take for new PGM mines to come online?
A: 5-10 years minimum from discovery to production. Timeline: Exploration (1-2 years), feasibility studies (1-2 years), permitting/approvals (1-2 years), financing secured (1 year), construction (2-3 years), ramp-up to full production (1-2 years). Total investment typically $1-3 billion. This long development cycle explains why PGM supply cannot quickly respond to price spikes—by the time new supply arrives, market conditions have often changed dramatically. This inelastic supply creates persistent price volatility.
Q: Will hydrogen fuel cells really use more platinum than catalytic converters?
A: Yes, significantly more per vehicle. Fuel cell vehicles (FCVs) contain 50-80 grams of platinum in the fuel cell stack (catalyzes hydrogen-oxygen reaction) versus 3-7 grams in a catalytic converter. However, adoption remains minimal—fewer than 50,000 FCVs globally versus 1.4 billion ICE vehicles. Even optimistic forecasts project only 2-5% of vehicles as hydrogen by 2040. While promising for platinum demand, hydrogen is unlikely to fully replace automotive catalyst demand lost to EVs. More likely scenario: stabilizes platinum but doesn't reverse declining trend.
Q: How does catalytic converter recycling impact global PGM supply?
A: Critically important—recycling provides 30-35% of annual global PGM supply. Without converter recycling, primary mines would need to increase production by ~50% to meet demand, requiring massive new mine development ($10-15 billion investment) and 5-10 years. Recycling also dampens price volatility by providing flexible secondary supply that responds to prices faster than mining. Your recycling operation through ScrapMonster's network is part of this essential supply chain supporting global automotive manufacturing.
Q: Can automakers stockpile PGMs to protect against price spikes?
A: They do, but limited effectiveness. Major automakers maintain 3-6 month inventories of PGMs to buffer against short-term disruptions. However, extended stockpiling is expensive (each $100M in inventory costs $5-8M annually in capital and storage) and risky (prices can drop, erasing value). During 2021 rhodium spike, even manufacturers with large inventories ran short as prices stayed elevated for 18+ months. Long-term solution has been substitution (Pt for Pd or vice versa) and thrifting (reducing total PGM content through better technology), not stockpiling.
Future Outlook & Strategy
Q: Should I get out of the catalytic converter business due to EVs?
A: Not yet. While EV adoption will gradually reduce demand, the existing 1.4 billion ICE vehicle fleet (average 12-15 year lifespan) ensures robust converter recycling opportunities through at least 2040-2045. Near-term (2025-2030) is actually favorable due to stricter emissions regulations driving higher PGM content per converter. Recommended strategy: Continue operations but plan for gradual transition. Diversify into related automotive recycling, consider battery recycling (EVs need this), and build relationships that can evolve as market changes. Businesses with 15-20 year horizons should remain viable and profitable.
Q: What PGM price levels make converter recycling unprofitable?
A: Rarely happens—even at price lows, recycling remains viable. During March 2020 COVID crash (rhodium $2,800, palladium $1,800, platinum $600), Foreign Medium converters still worth ~$180-200. Processing economics work at wide range of PGM prices because: (1) Material has already been manufactured (sunk cost), (2) Recycling still cheaper than mining, (3) Economies of scale for large processors. Only concern is if ALL three PGMs dropped 70%+ simultaneously AND stayed there for years—historically unprecedented and unlikely. More realistic risk is margin compression during prolonged low-price periods requiring operational efficiency improvements.
Q: How should I position my business for the next 5 years?
A: Short-term (2025-2028): Optimize operations for peak period. Build volume, improve identification expertise, develop multiple buyer relationships, invest in efficiency (XRF if volume justifies). Mid-term (2028-2032): Monitor EV adoption rates in your market, begin exploring adjacent opportunities (battery recycling, EV parts), maintain financial reserves for market volatility. Long-term (2032+): Evaluate diversification options, consider transition toward comprehensive automotive recycling, leverage established buyer relationships into new materials. Key principle: Extract maximum value during strong years while preparing for gradual evolution. Businesses that adapt methodically outperform those that react to crisis.
Q: Will PGM prices crash when EVs dominate the market?
A: Gradual decline more likely than crash. Market will see several years of warning as EV adoption accelerates—allowing time for supply side adjustments (mine closures, production cuts) and demand destruction to equilibrate prices at lower levels. Historical comparison: When leaded gasoline was phased out (1970s-1990s), lead prices declined 60-70% over 15 years, not overnight. Expect similar trajectory for PGMs: peak around 2025-2028, gradual 40-60% decline through 2040, stabilization at new equilibrium reflecting industrial demand plus specialty automotive applications. Sudden crash unlikely because of supply flexibility (mines can shut down) and large existing vehicle fleet providing decades of recycling supply.
Q: What are the biggest risks to my converter recycling business?
A: 1. Regulatory: Increased theft-related regulations raising compliance costs and complexity. 2. Price volatility: Sudden PGM price drops while holding inventory. 3. Competition: More entrants during high-price periods compressing margins. 4. Demand destruction: Faster-than-expected EV adoption. 5. Supply disruption: Loss of refinery access or buyer relationships. 6. Legal liability: Unknowingly buying stolen converters. Mitigation: Maintain rigorous documentation, diversify buyers, monitor markets daily, build working capital reserves, stay compliant with all regulations, insure operations adequately. Well-managed operations can navigate these risks successfully for many years ahead.
Technical & Processing
Q: Why does substrate condition affect converter value so much?
A: Damaged substrate reduces PGM recovery efficiency. Melted substrate (channels collapsed from overheating) reduces recovery 30-50% because PGMs are trapped in fused ceramic, requiring more aggressive, expensive chemical processing. Contaminated substrate (oil, coolant) must be cleaned before refining, adding costs. Missing substrate chunks mean proportionally less PGM content. These processing challenges translate directly to lower offers from buyers—damaged exotic converter worth $540 intact might fetch only $300-400 if badly damaged. Always assess and disclose condition truthfully.
Q: Can PGMs be recovered from badly burned or contaminated converters?
A: Yes, but at higher cost = lower payout. Even severely damaged converters retain their PGM content (metals don't burn or evaporate at normal exhaust temperatures). However, recovery becomes more difficult and expensive: burned substrates require longer processing, contamination must be removed chemically, and yield may be reduced. Professional processors can still extract 85-95% of PGMs from damaged units , but the added processing costs mean scrap price may be 30-70% lower than intact equivalents. Bottom line: Even damaged converters have value—don't discard them.
Q: What happens to converters after I sell them to a scrap buyer?
A: Step 1: Buyer aggregates converters into lots (often 100-500 units). Step 2: Sent to processing facility where converters are de-canned (substrate removed from steel housing using industrial saws). Step 3: Substrate ground to fine powder (<100 microns) in specialized mills. Step 4: Powder sampled and assayed to determine exact PGM content. Step 5: Powder sent to refinery for chemical processing—dissolved in acids, each metal separated and purified to 99.95%+. Step 6: Pure platinum, palladium, rhodium sold to manufacturers (automotive, jewelry, industrial). Step 7: Your recycled PGMs become new catalytic converters, completing the circular economy. Entire process: 4-12 weeks from your sale to refined metal.
Q: Are there different substrate materials and do they affect value?
A: Yes, two main types: Ceramic substrate (cordierite: 2MgO·2Al₂O₃·5SiO₂) - used in 95% of converters, standard processing, typical recovery rates. Metallic substrate (stainless steel mesh) - used in exotic/performance vehicles, better thermal properties, easier to process = slightly higher recovery rates. Metallic substrates may command 2-5% premium due to processing advantages. However, PGM content matters far more than substrate type—a ceramic converter with high PGM loading worth more than metallic with low loading. For identification purposes, metallic substrates appear as fine steel mesh rather than ceramic honeycomb when viewed through inlet/outlet.
Q: Can I process catalytic converters myself to get full value?
A: Technically possible but economically impractical and legally hazardous for small operators. Challenges: (1) Chemical hazards: Refining requires aqua regia, strong acids, toxic reagents—EPA permits and safety equipment mandatory. (2) Equipment costs: Industrial grinder ($50K+), assay equipment ($100K+), refining vessels ($200K+), fume hoods, waste treatment. (3) Technical expertise: Chemistry degree + years training to achieve high recovery rates. (4) Economies of scale: Only profitable at massive volume (10,000+ converters/year). (5) Environmental liability: Hazardous waste disposal costs $5-15 per converter. Unless processing 20,000+ converters annually, using established refineries via professional buyers is far more profitable and legal.