- 210 tons Domestic gold mine production in 2018
- 95 tons New and old gold scrap recycled in 2018
- $8.6 billion Value of the produced gold in 2018
Gold has been treasured since ancient times for its beauty and permanence. Most of the gold that is fabricated today goes into the manufacture of jewelry. However, because of its superior electrical conductivity and resistance to corrosion and other desirable combinations of physical and chemical properties, gold also emerged in the late 20th century as an essential industrial metal. Gold performs critical functions in computers, communications equipment, spacecraft, jet aircraft engines, and a host of other products. Although gold is important to industry and the arts, it also retains a unique status among all commodities as a long-term store of value. Until recent times, it was considered essentially a monetary metal, and most of the bullion produced each year went into the vaults of government treasuries or central banks.
| Salient Statistics | 2014 | 2015 | 2016 | 2017 | 2018 |
|---|---|---|---|---|---|
| Production: Mine | 210 | 214 | 228 | 237 | 210 |
| Production: Refinery(Primary) | 253 | 248 | 248 | 212 | 200 |
| Production: Refinery(Secondary-new and old scrap) | 135 | 124 | 123 | 96 | 95 |
| Imports for consumption | 308 | 265 | 374 | 255 | 220 |
| Exports | 492 | 478 | 393 | 461 | 480 |
| Consumption, reported | 152 | 165 | 169 | 146 | 145 |
| Price, dollars per troy ounce |
In 2018, domestic gold mine production was estimated to be about 210 tons, 11% less than that in 2017, and the value was estimated to be about $8.6 billion. Gold was produced in 12 States at more than 40 lode mines, at several large placer mines in Alaska, and numerous smaller placer mines (mostly in Alaska and in the Western States). About 6% of domestic gold was recovered as a byproduct of processing domestic basemetal ores, chiefly copper ores. The top 28 operations yielded more than 99% of the mined gold produced in the United States. Commercial-grade gold was produced at about 15 refineries. A few dozen companies, out of several thousand companies and artisans, dominated the fabrication of gold into commercial products. U.S. jewelry manufacturing was heavily concentrated in the New York, NY, and Providence, RI, areas, with lesser concentrations in California, Florida, and Texas. Estimated domestic uses (excluding gold bullion bar) were jewelry, 46%; electrical and electronics, 40%; official coins, 9%; and other, 5%.
In 2018, an estimated 95 tons of new and old scrap was recycled, about 66% of reported consumption. The domestic supply of gold from recycling decreased slightly compared with 2017.
- Canada, 24%
- Mexico, 23%
- Colombia, 11%
- Peru, 10%
- Other, 32%
| Item | Number | Normal Trade Relations 12–31–18 |
|---|---|---|
| Gold content of silver ores | 2616.10.0080 | 0.8¢/kg on lead content |
| Gold content of other ores | 2616.90.0040 | 1.7¢/kg on lead content. |
| Gold bullion | 7108.12.1013 | Free |
| Gold dore | 7108.12.1020 | Free |
15% (Domestic), 14% (Foreign).
The U.S. Department of the Treasury maintains stocks of gold (see salient statistics above), and the U.S. Department of Defense administers a Governmentwide secondary precious-metals recovery program.
The estimated gold price in 2018 was slightly more than the price in 2017 but was 24% lower than the record-high annual price in 2012. The Engelhard daily price of gold in 2018 fluctuated through several cycles. Early in the year, the gold price reached a projected annual high of $1,363.96 per troy ounce on January 25. During this time, the weak U.S. dollar spurred investors to purchase more gold. Starting in late April, the price began a downward trend and reached $1,179.65 per troy ounce on August 16 as investors reportedly were investing in the strong U.S. dollar rather than in gold. The price was relatively flat for the rest of August and September but started to increase in October and into November. The price fell to the year-to-date low (and projected annual low) of $1,130.57 per troy ounce on October 19. The price quickly recovered and continued to trend upward to mid-November.
The 11% decrease in domestic mine production in 2018 was attributed to decreases in production from the Cortez Mine in Nevada, the Cresson Mine in Colorado, the Fort Knox Mine in Alaska, and Newmont mines in Nevada, and to the shutdown of the Kettle River-Buckhorn Mine in Washington in 2017. In 2018, worldwide gold mine production was estimated to have increased slightly from that in 2017. New mine production in Canada and Russia and increased production from the Grasberg Mine in Indonesia more than offset decreased gold mine production in China, owing to increased environmental regulations, and in the United States.
In the first 9 months of 2018, domestic consumption of gold used in the production of coins and bars decreased by more than 19%; however, gold consumption for jewelry increased by 5% because of increased purchases by consumers, owing to the continually improved U.S. economic conditions in the first 9 months, evident by the 2.2%, 4.2%, and 3.5% increases in Gross Domestic Product in the first three quarters of 2018. Globally, gold consumption by the jewelry industry increased slightly and for gold coins and bars decreased slightly compared with that in the first 9 months of 2017. Investments in gold-based exchange-traded funds were significantly lower in the United States and slightly lower in the world during the same period.
| Country | 2017 | 2018 |
|---|---|---|
| United States | 237 | 210 |
| Australia | 301 | 310 |
| Brazil | 80 | 81 |
| Canada | 164 | 185 |
| China | 426 | 400 |
| Ghana | 128 | 130 |
| Indonesia | 75 | 85 |
| Kazakhstan | 85 | 85 |
| Mexico | 126 | 125 |
| Papua New Guinea | 64 | 65 |
| Peru | 151 | 145 |
| Russia | 270 | 295 |
| South Africa | 137 | 120 |
| Uzbekistan | 104 | 105 |
| Other countries | 883 | 920 |
Reserves for Canada, Peru, and Russia were revised based on Government or industry reports.
An assessment of U.S. gold resources indicated 33,000 tons of gold in identified (15,000 tons) and undiscovered (18,000 tons) resources.9 Nearly one-quarter of the gold in undiscovered resources was estimated to be contained in porphyry copper deposits. The gold resources in the United States, however, are only a small portion of global gold resources.
Base metals clad with gold alloys are widely used in electrical and electronic products, and in jewelry to economize on gold; many of these products are continually redesigned to maintain high-utility standards with lower gold content. Generally, palladium, platinum, and silver may substitute for gold.
Get an instant offer on your damaged car

Get an offer instantly
Just tell us a bit about your car and boom, there's your offer.

Free pickup
You have seven days to accept our offer and schedule pickup.

Get paid on the spot
Our pickup partner will do a quick inspection, and hand you a check.
More from Recycling
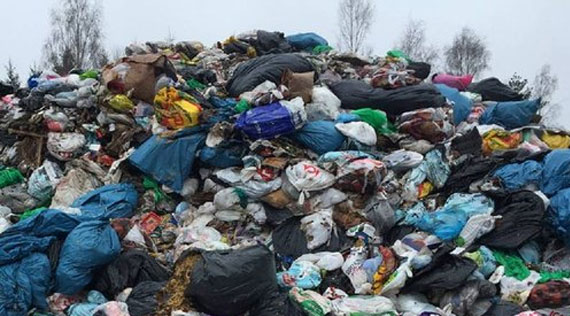
- 267.8 million tons of municipal solid waste generated in 2017
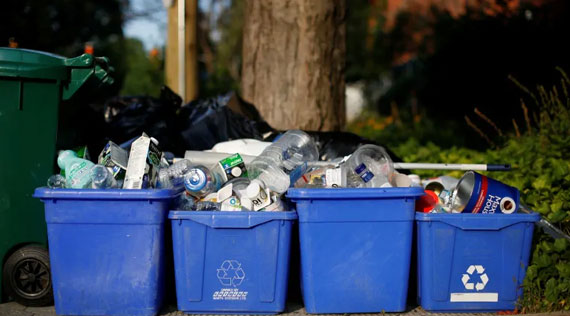
- 46% is the statewide recycling rate in 2018
- 59% is the highest recycling rate recorded in the Central Virginia Waste Management Authority
- 29% is the lowest rate recorded in the Virginia Peninsulas Public Service Authority
- 17.2% Colorado’s recycling rate improves in 2018
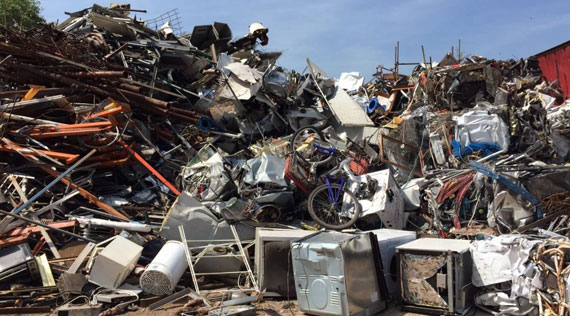
- 178564008 Metric Tons of Scrap exported in 2017
- $ 97315662168 Valued Scrap exported in 2017