- 267.8 million tons of municipal solid waste generated in 2017
The total generation of municipal solid waste in 2017 was 267.8 million tons (U.S. short tons, unless specified) of MSW, approximately 5.7 million tons more than the amount generated in 2015. MSW generated in 2017 increased to 4.51 pounds per person per day. This is an increase from the 262.1 million tons generated in 2015 and the 208.3 million tons in 1990.
| Materials | MSW (%) |
|---|---|
| Misc. Inorganic Wastes | 1.5 |
| Other | 1.9 |
| Textiles | 6.3 |
| Rubber and Leather | 3.4 |
| Wood | 6.7 |
| Food | 15.2 |
| Yard Trimmings | 13.1 |
| Plastics | 13.2 |
| Metals | 9.4 |
| Glass | 4.2 |
| Paper and Paperboard | 25.0 |
| Year | Glass | Paper & Paperboard | Food | Metals | Misc Inorganic Waste | Plastics | Rubber & Leather | Textiles | Wood | Yard Trimmings | Other |
|---|---|---|---|---|---|---|---|---|---|---|---|
| 1960 | 6720000 | 29990000 | 12200000 | 10820000 | 1300000 | 390000 | 1840000 | 1760000 | 3030000 | 20000000 | 70000 |
| 1970 | 12740000 | 44310000 | 12800000 | 13830000 | 1780000 | 2900000 | 2970000 | 2040000 | 3720000 | 23200000 | 770000 |
| 1980 | 15130000 | 55160000 | 13000000 | 15510000 | 2250000 | 6830000 | 4200000 | 2530000 | 7010000 | 27500000 | 2520000 |
| 1990 | 13100000 | 72730000 | 23860000 | 16550000 | 2900000 | 17130000 | 5790000 | 5810000 | 12210000 | 35000000 | 3190000 |
| 2000 | 12770000 | 87740000 | 30700000 | 18940000 | 3500000 | 25550000 | 6670000 | 9480000 | 13570000 | 30530000 | 4000000 |
| 2005 | 12540000 | 84840000 | 32930000 | 20400000 | 3690000 | 29380000 | 7290000 | 11510000 | 14790000 | 32070000 | 4290000 |
| 2010 | 3130000 | 44570000 | 970000 | 7920000 | 2500000 | 1440000 | 2050000 | 2280000 | 19200000 | 1370000 | |
| 2015 | 3190000 | 45320000 | 2100000 | 8030000 | 3120000 | 1550000 | 2460000 | 2660000 | 21290000 | 1230000 | |
| 2016 | 3160000 | 45520000 | 2150000 | 8180000 | 3240000 | 1760000 | 2510000 | 2940000 | 22960000 | 1320000 | |
| 2017 | 3030000 | 44170000 | 2570000 | 8330000 | 2960000 | 1670000 | 2570000 | 3000000 | 24420000 | 1450000 |
| Materials | MSW Combusted (%) |
|---|---|
| Misc. Inorganic Wastes | 2.3 |
| Other | 2.0 |
| Textiles | 9.3 |
| Rubber and Leather | 7.3 |
| Wood | 8.4 |
| Paper and Paperboard | 13.2 |
| Glass | 4.3 |
| Metals | 8.6 |
In 2017, 34 million tons of MSW were combusted with energy recovery. Food made up the largest component of MSW combusted at approximately 22 percent. Rubber, leather and textiles accounted for over 16 percent of MSW combustion. Plastics comprised about 16 percent, and paper and paperboard made up about 13 percent. The other materials accounted for less than 10 percent each.
| Year | Glass | Paper & Paperboard | Food | Metals | Misc.Inorganic Waste | Plastics | Rubber & Leather | Textiles | Wood | Yard Trimmings | Other |
|---|---|---|---|---|---|---|---|---|---|---|---|
| 1970 | 60000 | 150000 | 50000 | 60000 | 10000 | 10000 | 10000 | 10000 | 90000 | ||
| 1980 | 300000 | 860000 | 260000 | 300000 | 50000 | 140000 | 70000 | 50000 | 150000 | 550000 | 30000 |
| 1990 | 1810000 | 8930000 | 4060000 | 2050000 | 490000 | 2980000 | 830000 | 880000 | 2080000 | 5240000 | 410000 |
| 2000 | 1790000 | 9730000 | 5820000 | 2050000 | 680000 | 4120000 | 1970000 | 1880000 | 2290000 | 2860000 | 540000 |
| 2005 | 1660000 | 7800000 | 5870000 | 2100000 | 670000 | 4330000 | 2110000 | 2110000 | 2270000 | 2220000 | 510000 |
| 2010 | 1360000 | 4740000 | 6150000 | 2310000 | 680000 | 4530000 | 1910000 | 2270000 | 2310000 | 2510000 | 540000 |
| 2015 | 1440000 | 4450000 | 7380000 | 2720000 | 780000 | 5330000 | 2520000 | 3060000 | 2570000 | 2630000 | 670000 |
| 2016 | 1440000 | 4300000 | 7480000 | 2780000 | 790000 | 5340000 | 2650000 | 3240000 | 2860000 | 2350000 | 670000 |
| 2017 | 1480000 | 4490000 | 7470000 | 2920000 | 790000 | 5590000 | 2490000 | 3170000 | 2850000 | 2110000 | 670000 |
| Materials | MSW Landfill(%) |
|---|---|
| Misc.Inorganic Wastes | 2.3 |
| Other | 2.1 |
| Textiles | 8.0 |
| Rubber and Leather | 3.5 |
| Wood | 8.7 |
| Food | 21.9 |
| Yard Trimmings | 6.2 |
| Paper and Paperboard | 13.1 |
| Glass | 4.9 |
| Metals | 9.9 |
| Plastics | 19.2 |
In 2017, about 139.6 million tons of MSW were landfilled. Food was the largest component at about 22 percent. Plastics accounted for about 19 percent, paper and paperboard made up about 13 percent, and rubber, leather and textiles comprised over 11 percent. Other materials accounted for less than 10 percent each.
| Year | Glass | Paper & Paperboard | Food | Metals | Misc. Inorganic Waste | Plastics | Rubber & Leather | Textiles | Wood | Yard Trimmings | Other |
|---|---|---|---|---|---|---|---|---|---|---|---|
| 1960 | 6620000 | 24910000 | 12200000 | 10770000 | 1300000 | 390000 | 1510000 | 1710000 | 3030000 | 20000000 | 70000 |
| 1970 | 12520000 | 37390000 | 12750000 | 13290000 | 1770000 | 2900000 | 2710000 | 1970000 | 3710000 | 23110000 | 470000 |
| 1980 | 14080000 | 42560000 | 12740000 | 13990000 | 2200000 | 6670000 | 4000000 | 2320000 | 6860000 | 26950000 | 1990000 |
| 1990 | 8660000 | 43570000 | 19800000 | 10530000 | 2410000 | 13780000 | 4590000 | 4270000 | 10000000 | 25560000 | 2100000 |
| 2000 | 8100000 | 40450000 | 24200000 | 10290000 | 2820000 | 19950000 | 3880000 | 6280000 | 9910000 | 11900000 | 2480000 |
| 2005 | 8290000 | 35080000 | 26370000 | 11310000 | 3020000 | 23270000 | 4130000 | 7570000 | 10690000 | 9990000 | 2570000 |
| 2010 | 7030000 | 22000000 | 28620000 | 12220000 | 3160000 | 24370000 | 4400000 | 8900000 | 11120000 | 11690000 | 2800000 |
| 2015 | 6840000 | 18280000 | 30250000 | 13120000 | 3210000 | 26030000 | 4490000 | 10540000 | 11070000 | 10800000 | 2980000 |
| 2016 | 6880000 | 17660000 | 30680000 | 13640000 | 3230000 | 26290000 | 4790000 | 11130000 | 12250000 | 9640000 | 2990000 |
| 2017 | 6870000 | 18350000 | 30630000 | 13800000 | 3250000 | 26820000 | 4950000 | 11150000 | 12140000 | 8650000 | 2980000 |
| Materials | MSW (%) |
|---|---|
| Textiles | 2.7 |
| Rubber and Leather | 1.8 |
| Wood | 3.2 |
| Food | 2.7 |
| Yard Trimmings | 25.9 |
| Plastics | 3.1 |
| Metals | 8.8 |
| Glass | 3.2 |
| Paper and Paperboard | 46.9 |
| Other | 1.5 |
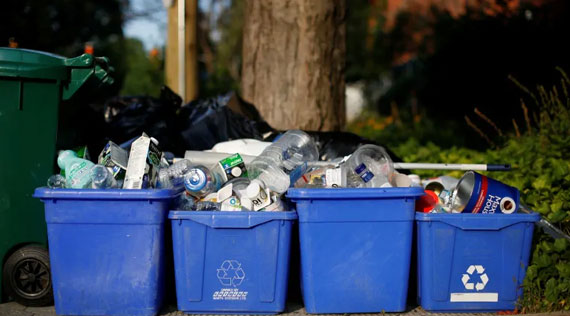
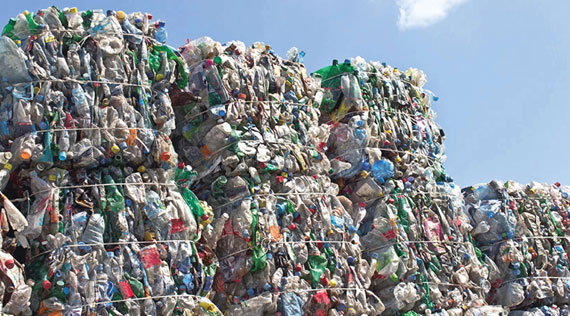
Recycling
The total MSW recycled was 67.2 million tons, with paper and paperboard accounting for approximately 66 percent of that amount. Metals comprised about 12 percent, while glass, plastic and wood made up between 4 and 5 percent.
Composting
The total MSW composted was 27 million tons. This included approximately 24.4 million tons of yard trimmings (more than a five-fold increase since 1990) and 2.6 million tons of food waste.
| Year | Glass | Paper and Paperboard | Food | Metals | Plastics | Rubber & Leather | Textiles | Wood | Yard Trimmings | Other |
|---|---|---|---|---|---|---|---|---|---|---|
| 1960 | 100000 | 5080000 | 50000 | 330000 | 50000 | |||||
| 1970 | 160000 | 6770000 | 480000 | 250000 | 60000 | 300000 | ||||
| 1980 | 750000 | 11740000 | 1220000 | 20000 | 130000 | 160000 | 5000000 | |||
| 1990 | 2630000 | 20230000 | 3970000 | 370000 | 370000 | 660000 | 130000 | 4200000 | 680000 | |
| 2000 | 2880000 | 37560000 | 680000 | 6600000 | 1480000 | 820000 | 1320000 | 1370000 | 15770000 | 980000 |
| 2005 | 2590000 | 41960000 | 690000 | 6990000 | 1780000 | 1050000 | 1830000 | 1830000 | 19860000 | 1210000 |
| 2010 | 3130000 | 44570000 | 970000 | 7920000 | 2500000 | 1440000 | 2050000 | 2280000 | 19200000 | 1370000 |
| 2015 | 3190000 | 45320000 | 2100000 | 8030000 | 3120000 | 1550000 | 2460000 | 2660000 | 21290000 | 1230000 |
| 2016 | 3160000 | 45520000 | 2150000 | 8180000 | 3240000 | 1760000 | 2510000 | 2940000 | 22960000 | 1320000 |
| 2017 | 3030000 | 44170000 | 2570000 | 8330000 | 2960000 | 1670000 | 2570000 | 3000000 | 24420000 | 1450000 |
| Materials (%) | 1960 | 1970 | 1980 | 1990 | 2000 | 2005 | 2010 | 2015 | 2016 | 2017 |
|---|---|---|---|---|---|---|---|---|---|---|
| Paper and Paperboard | 17 | 15 | 21 | 28 | 43 | 50 | 63 | 67 | 68 | 66 |
| Glass | 2 | 1 | 5 | 20 | 23 | 21 | 27 | 28 | 28 | 27 |
| Plastics | 2 | 6 | 6 | 8 | 9 | 9 | 8 | |||
| Yard Trimmings | 12 | 52 | 62 | 58 | 61 | 66 | 69 | |||
| Lead-acid batteries | 76 | 70 | 97 | 93 | 96 | 99 | 99 | 99 | 99 |
In percentage of total MSW generation, recycling (including composting) did not exceed 15 percent until 1990. Growth in the recycling rate was significant over the next 15 years, spanning until 2005. The recycling rate grew more slowly over the last few years. The 2017 recycling rate was 35.2 percent.
Get an instant offer on your damaged car

Get an offer instantly
Just tell us a bit about your car and boom, there's your offer.

Free pickup
You have seven days to accept our offer and schedule pickup.

Get paid on the spot
Our pickup partner will do a quick inspection, and hand you a check.
More from Recycling
- 46% is the statewide recycling rate in 2018
- 59% is the highest recycling rate recorded in the Central Virginia Waste Management Authority
- 29% is the lowest rate recorded in the Virginia Peninsulas Public Service Authority
- 17.2% Colorado’s recycling rate improves in 2018
- 178564008 Metric Tons of Scrap exported in 2017
- $ 97315662168 Valued Scrap exported in 2017
- 11869461 Metric Tons Plastic Scrap exported in 2015
- 11743659 Metric Tons Plastic Scrap exported in 2016
- 10572428 Metric Tons Plastic Scrap exported in 2017