Loading prices...
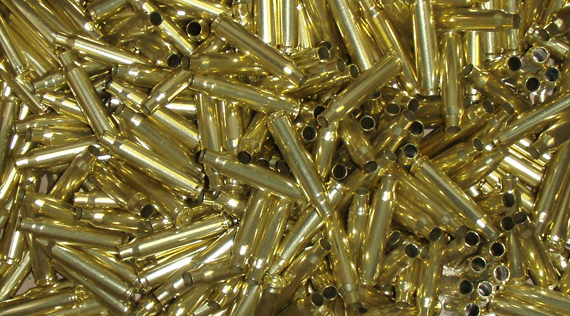
ALBANY (Scrap Monster): According to the Copper and Brass Fabricators Council (CBFC), the imports of brass mill products by the US during the month of October this year have increased significantly when matched with the previous year. Also, exports registered modest rise year-on-year during the month.
October ’16 Imports
According to data, the US imports of brass mill products during October this year totaled 38.602 million lb, significantly higher by 5.0% when compared with 36.760 million lb imports registered during October 2015.
The main exporter of brass mill products to the US during October was Germany. The total imports from Germany during the month totaled 10.687 million lb. Canada followed Germany with total exports to US amounting to 3.926 million lb. In third place was Mexico. The brass mill products imports by the US from Mexico totaled 3.865 million lb during the month. The other key exporters were South Korea (3.308 million lb) and Peru (2.154 million lb).
Imports by Product Type
Imports of all sheet, strip, plate and foil products totaled 15.075 million lb in October. All pipe and tube products imports totaled 13.201 million lb. Imports of all profiles, rods and bars totaled 7.125 million lb. Copper alloy wire imports totaled 3.201 million lb.
October ’16 Exports
In accordance with the data released by the CBFC, the US exports of brass mill products totaled 22.407 million lb in October this year, significantly up by nearly 10.5% when matched with the exports of 20.287 million lb during October 2015.
The key export destination for US brass mill products during October ’16 was Mexico. The exports to Mexico totaled 8.772 million lb. The other key importers of US brass mill products during the month were Canada (5.706 million lb), South Korea (2.540 million lb), China (1.116 million lb) and Saudi Arabia (633,908 lb).
Exports by Product Type
Exports of all sheet, strip, plate and foil products totaled 9.638 million lb in October this year. All pipe and tube products exports totaled 3.830 million lb. Exports of all profiles, rods and bars totaled 7.315 million lb. Copper alloy wire exports totaled 1.624 million lb.
Year-to-date Imports/Exports
For the first ten months of the year, US imported 384.732 million lb of brass mill products. This is 8.0% lower when compared with the imports of 417.699 million lb in the same year-ago period. Exports during the initial ten months of 2016 totaled 203.536 million lb, compared with 208.794 million lb in the same 2015 period, a decline of nearly 3%.
The CBFC noted that the export data for three months-February, March and April are likely to contain approximately 45 million pounds of products wrongly classified as copper rod and bar by importers/brokers. An inquiry has been initiated into the matter so as to remove this error from the Year-To-Date data at the earliest.
The table below provides the details of imports of brass mill products during the initial ten months of the current year.
Month---> | Jan | Feb | Mar | Apr | May | Jun | Jul | Aug | Sep | Oct |
Import Qty(In lb) | 33.532 | 34.296 | 40.125 | 39.659 | 42.740 | 40.921 | 42.291 | 40.238 | 32.328 | 38.60 |
The details of exports of brass mill products during January to October this year are as follows:-
Month---> | Jan | Feb | Mar | Apr | May | Jun | Jul | Aug | Sep | Oct |
Export Qty(In lb) | 17.876 | 37.184 | 39.303 | 32.901 | 20.410 | 21.021 | 18.710 | 20.864 | 20.504 | 22.407 |
About CBFC
The Copper and Brass Fabricators Council is a non-profit membership trade association open to any person, firm, or corporation engaged in the fabrication or production in the United States of products made, in whole or in part, from copper or copper alloys.
Generally, the member companies are engaged in the production of copper and copper alloy sheet and strip, rod and bar, plumbing tubing, OEM or air-conditioning tubing, wire, extrusions, shapes and profiles, forgings, and fittings. These products are used chiefly in the automotive, construction, and electrical/electronic industries.
There are currently nineteen member companies who produce over 80% of all copper and brass mill products produced in the United States.
| Copper Scrap View All | |
| Alternator | 0.32 (0.01) |
| #1 Copper Bare Bright | 3.77 (0.07) |
| Aluminum Scrap View All | |
| 356 Aluminum Wheels (Clean) | 0.73 (0.02) |
| 6061 Extrusions | 0.64 (0.02) |
| Steel Scrap View All | |
| #1 Bundle | 475.00 (0) |
| #1 Busheling | 495.00 (0) |
| Electronics Scrap View All | |
 Member
Full access to:
$49 USD/MONTH